Latest Projections
Population projection, age limits and life expectancy coefficient
The population projection used in the calculations was prepared by the Finnish Centre for Pensions in spring 2026. At the end of 2025, the population stood at 5.66 million; it is projected to fall to 5.3 million by 2100. Life expectancy for a newborn will rise from 79.8 years in 2025 to 91.4 years in 2100, and for women from 82.3 years to 93.5 years correspondingly. In 2025, people aged 65 or over accounted for 38.5% of the population aged 15–64. By the end of the century, this old-age dependency ratio will rise to nearly 70%.
For those born in 1955 or later, the retirement age will rise by three months per age cohort until it is 65 years for those born in 1962. For those born in 1965 or later, the retirement age is linked to the development of the life expectancy coefficient.
The amount of the old-age pension is adjusted with the life expectancy coefficient based on changes in the expected life expectancy of retirees. Old-age pensions are adjusted with the life expectancy coefficient confirmed for each age cohort at the age of 62. In 2030, the value of the life expectancy coefficient will be 0.941 and in 2100 it will be 0.831. A target retirement age is determined for each age cohort. If retirement is deferred until the target retirement age, the increment for late retirement will be at least of the same size as the effects of the life expectancy coefficient. A target retirement age has not been calculated for younger age cohorts since their target retirement age would be higher than the age at which their insurance obligation ends.
Age limits of the earnings-related pension system
| Year of birth | Retirement age | Target retirement age | Age at which insurance obligation ends |
| 1961 | 64 yrs 9 mos | 66 yrs | 69 yrs |
| 1962 | 65 yrs | 66 yrs 3 mos | 70 yrs |
| 1963 | 65 yrs | 66 yrs 2 mos | 70 yrs |
| 1964 | 65 yrs | 66 yrs 3 mos | 70 yrs |
| 1965 | 65 yrs | 66 yrs 3 mos | 70 yrs |
| 1970 | 65 yrs 7 mos | 67 yrs | 70 yrs |
| 1975 | 66 yrs 1 mos | 67 yrs 9 mos | 70 yrs |
| 1980 | 66 yrs 6 mos | 68 yrs 5 mos | 70 yrs |
| 1985 | 67 yrs | 69 yrs 1 mos | 70 yrs |
| 1990 | 67 yrs 5 mos | 69 yrs 8 mos | 70 yrs |
| 1995 | 67 yrs 11 mos | – | 70 yrs |
| 2000 | 68 yrs 3 mos | – | 70 yrs |
| 2005 | 68 yrs 8 mos | – | 70 yrs |
| 2010 | 69 yrs | – | 70 yrs |
Pension expenditure and pension levels
This section presents the development of pension expenditure and pension levels in the baseline projection of the report. Other results and alternative scenarios are presented in the report Lakisääteiset eläkkeet – pitkän aikavälin laskelmat 2026 (in Finnish) and the Skeneraattori(scenario generation) application (in Finnish).
The ratio of statutory pension expenditure to GDP increased from 12.0% in 2010 to 14.4% in 2025. The ratio will continue to rise until 2035, but the average pension relative to average earnings will decline slightly.
Until 2035, the number of pensioners will increase, while the average pension relative to average earnings will fall slightly. As a result, pension expenditure as a share of GDP will remain fairly stable over this period. After 2035, the number of pensioners will stop increasing, causing pension expenditure to decline relative to GDP. The ratio will fall to 12.4% by mid-century.
Around 2050, the decline in the average pension relative to average earnings will fall at a slower pace, and the number of pension recipients will begin to increase again. For these reasons, the ratio of pension expenditure to GDP will start to grow. This trend will continue until the 2080s. In 2100, statutory pension expenditure will amount to 15.5% of GDP.
In 2025, the average pension was just over 51% of average earnings. Throughout the projection period, the average pension will grow more slowly than average earnings. By 2040, the ratio of the average pension to average earnings will fall to 47%, and by 2100 to 40%. The life expectancy coefficient will have the largest effect. In addition, the age structure of pensioners will become older on average in the first few decades as the large age cohorts age. This will reduce pensions relative to earnings because indexation under the pension system is only partly linked to earnings growth.
Statutory pension expenditure, % of GDP
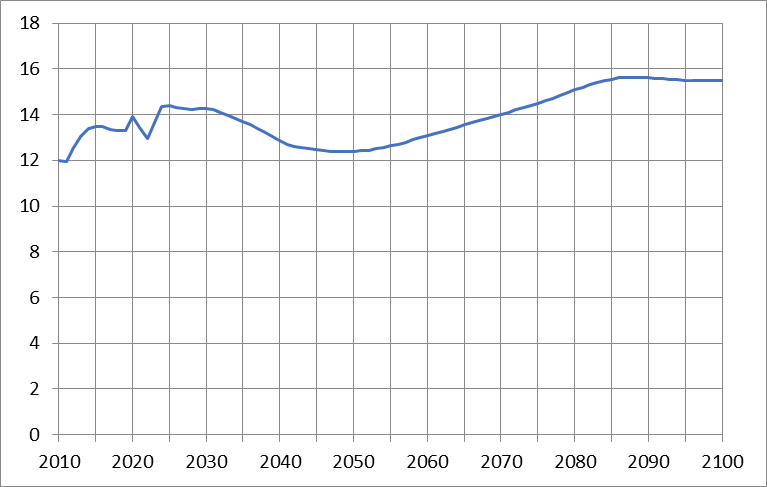
Source: Finnish Centre for Pensions
Average pension, % of average wage
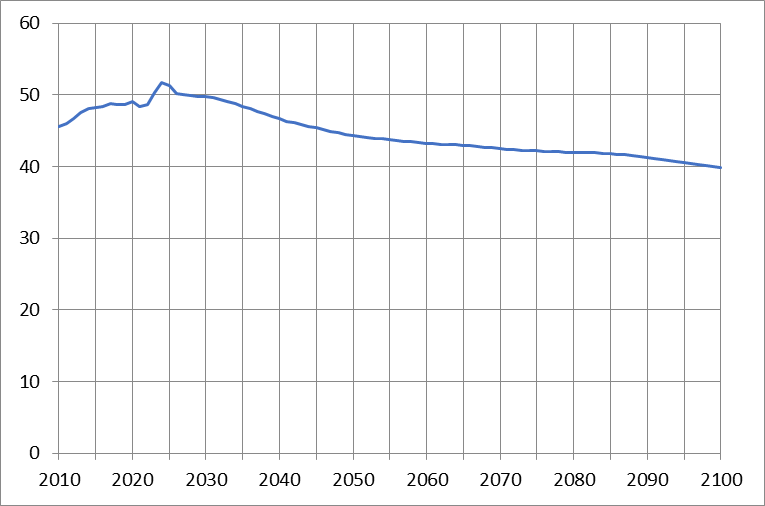
Source: Finnish Centre for Pensions
TyEL contribution
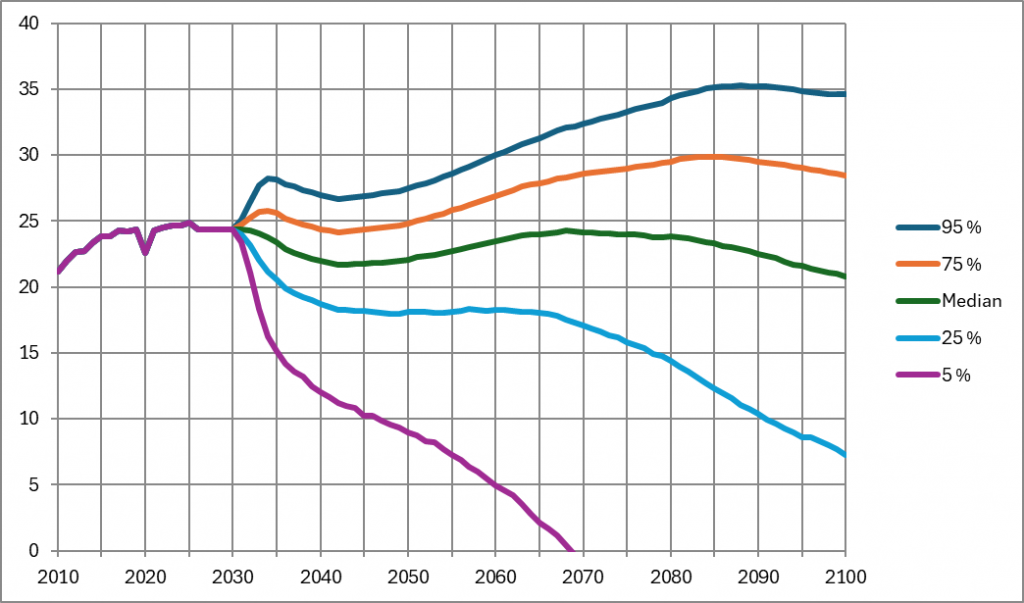
Until 2030, the TyEL contribution rate is fixed at 24.4%. After that, uncertainty around the contribution rate begins to increase rapidly. In the figure below, this uncertainty is reflected in the marked divergence between the percentiles shown. If investment returns are exceptionally strong, the TyEL contribution rate may fall to a very low level. It may even become negative as a result of client bonuses or a negative pooled component. The 5th percentile falls to around -28% by the end of the projection period in 2100. Even in a scenario of exceptionally weak returns, however, the contribution rate cannot rise significantly above pension expenditure.
The median TyEL contribution rate falls from its current level in the 2030s and reaches its lowest point in the early 2040s. The downward pressure on the contribution rate is explained by the decline in TyEL expenditure as a percentage of wages during the 2030s. After that, the median contribution rate rises until the late 2060s, before turning down again.
TyEL contribution rate, % of wages: percentiles from the stochastic projection
More on other sites: