Pensioners’ economic wellbeing
The economic wellbeing of pensioners has improved over the decades. The vast majority is not currently experiencing any significant livelihood problems. However, despite the favourable development, some pensioners still find it very difficult to make ends meet.
The aim of pensions is to maintain a decent income in retirement and to prevent poverty. Statutory pensions are the most important source of income for pensioners.
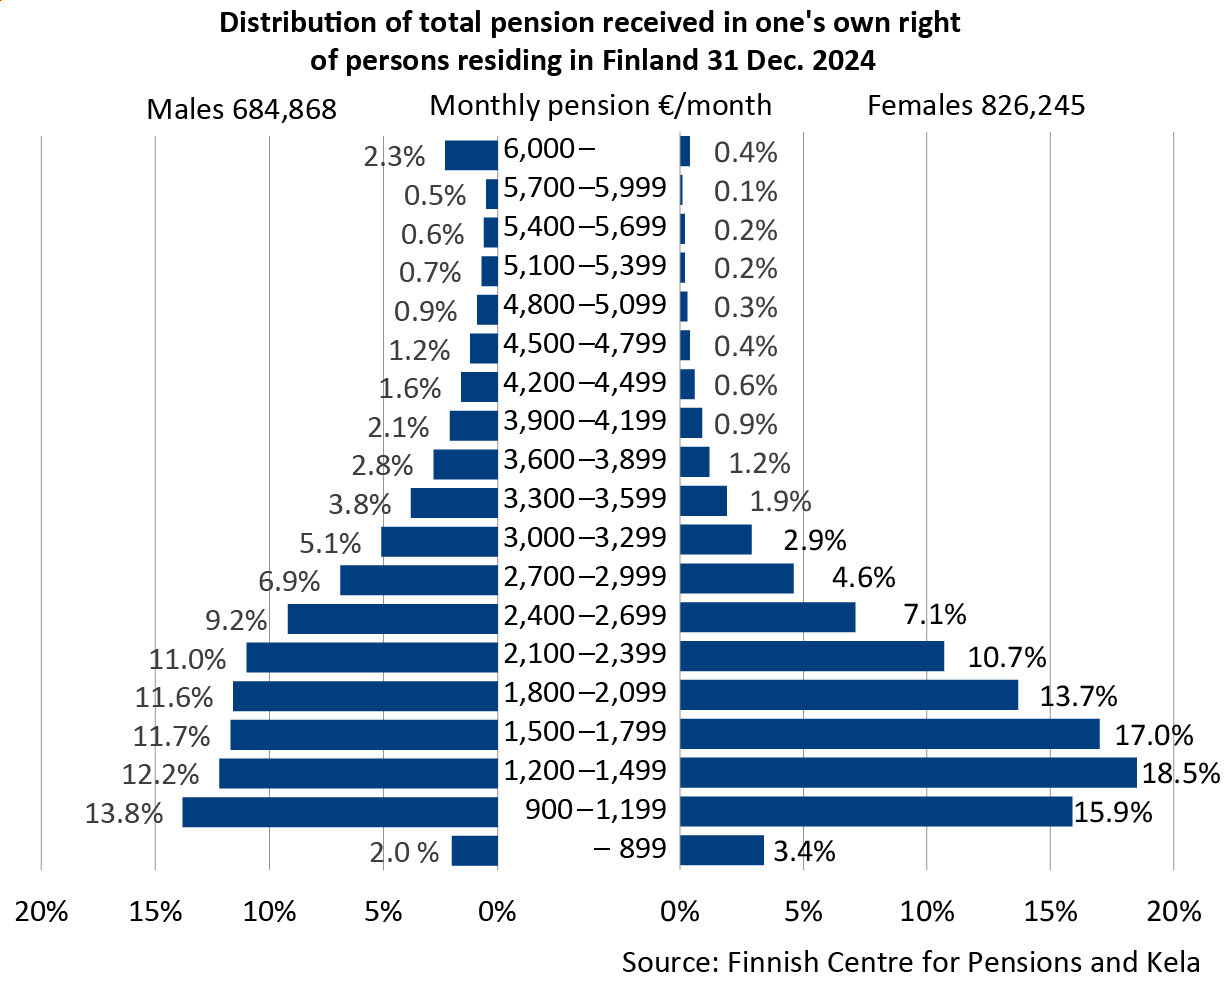
The average monthly total pension of pensioners living in Finland at year-end 2024 was 2,100 euros. The average total pension has increased in the 2000s by more than one third.
The main part of the increase in total pension is due to changes in pension recipients. New pension recipients have been able to accrue a pension throughout their working life. Their working lives have also spanned a longer period, and their income have been higher than those of older pension recipients.
Read more on Etk.fi:
Publications:
- Kuivalainen et al. 2022. Pensions and pensioners’ economic wellbeing – Development from 1995 to 2020 (Julkari, summary in English)
- Pension Indicators 2023 (Julkari, summary in English)
Women’s monthly pension is one fifth smaller than men’s
Men’s average total monthly pension in 2024 was 2,349 euros and women’s 1,893. The gender gap has narrowed in the last decades, but the development has been slow, and women’s average monthly pensions continue to be around one fifth lower than men’s.
The difference in men’s and women’s earnings also affects the gender gap in pensions. There is no large gender gap in the average employment rates, length of working life or retirement today, but the difference in wages is considerable also internationally. The uneven distribution of family leaves, particularly long periods of home care allowance, contribute to gaps in earnings and pensions.
Publications:
- Kuivalainen et al. 2019. Naisten ja miesten eläke-erot – katsaus tutkimukseen ja tilastoihin (Pension differences between women and men – Overview of research and statistics) (Valto, abstract in English)
- Rantala et al. 2019. Samankaltaistuuko ikäihmisten köyhyys? Näkökulmia 75–84-vuotiaiden naisten ja miesten pienituloisuuteen (Is the poverty gender gap shrinking? Perspectives on poverty rates among older men and women aged 75–84) (Julkari)
- Rantala & Riihelä 2016. Income differences between retired women and men in 1995-2013 (Julkari, summary in English)
- Ritola 2020. Pensions and Gender Equality: Gap in Men’s and Women’s Pensions through Example Cases from Five Cohorts (Julkari, summary in English)
Average total pension of disability pension recipients around one third less than of old-age pension recipients
Earnings-related pensions are based on earnings from work. Disability pension recipients have a shorter working life than others. In particular, earnings-related pensions of those who retire on a disability pension at an early age are often lower than average, as the disability pension recipients have had a shorter time to earn a pension, and the earnings level that the projected pension component is based on is typically low.
The average disability pension level has decreased in the 2000s because disability pension recipients are younger than before and spend a longer time in retirement.
Publications:
- Ahonen et al. 2018. Pensioners’ perceived economic welfare in 2017 (Julkari, summary in English)
- Polvinen et al. 2020. Explanations for economic difficulties among old-age pensioners previously on disability pension (European Journal of Public Health)
- Rantala et al.2017. The economic welfare of disability pensioners in the 2000s (Julkari, summary in English)
- Rantala & Laaksonen 2022. Ovatko työkyvyttömyyseläkeläisten eläkkeet pienentyneet? (Have the pensions of disability pension recipients become smaller?) (Julkari)
Pensions make up a large part of pensioners’ income
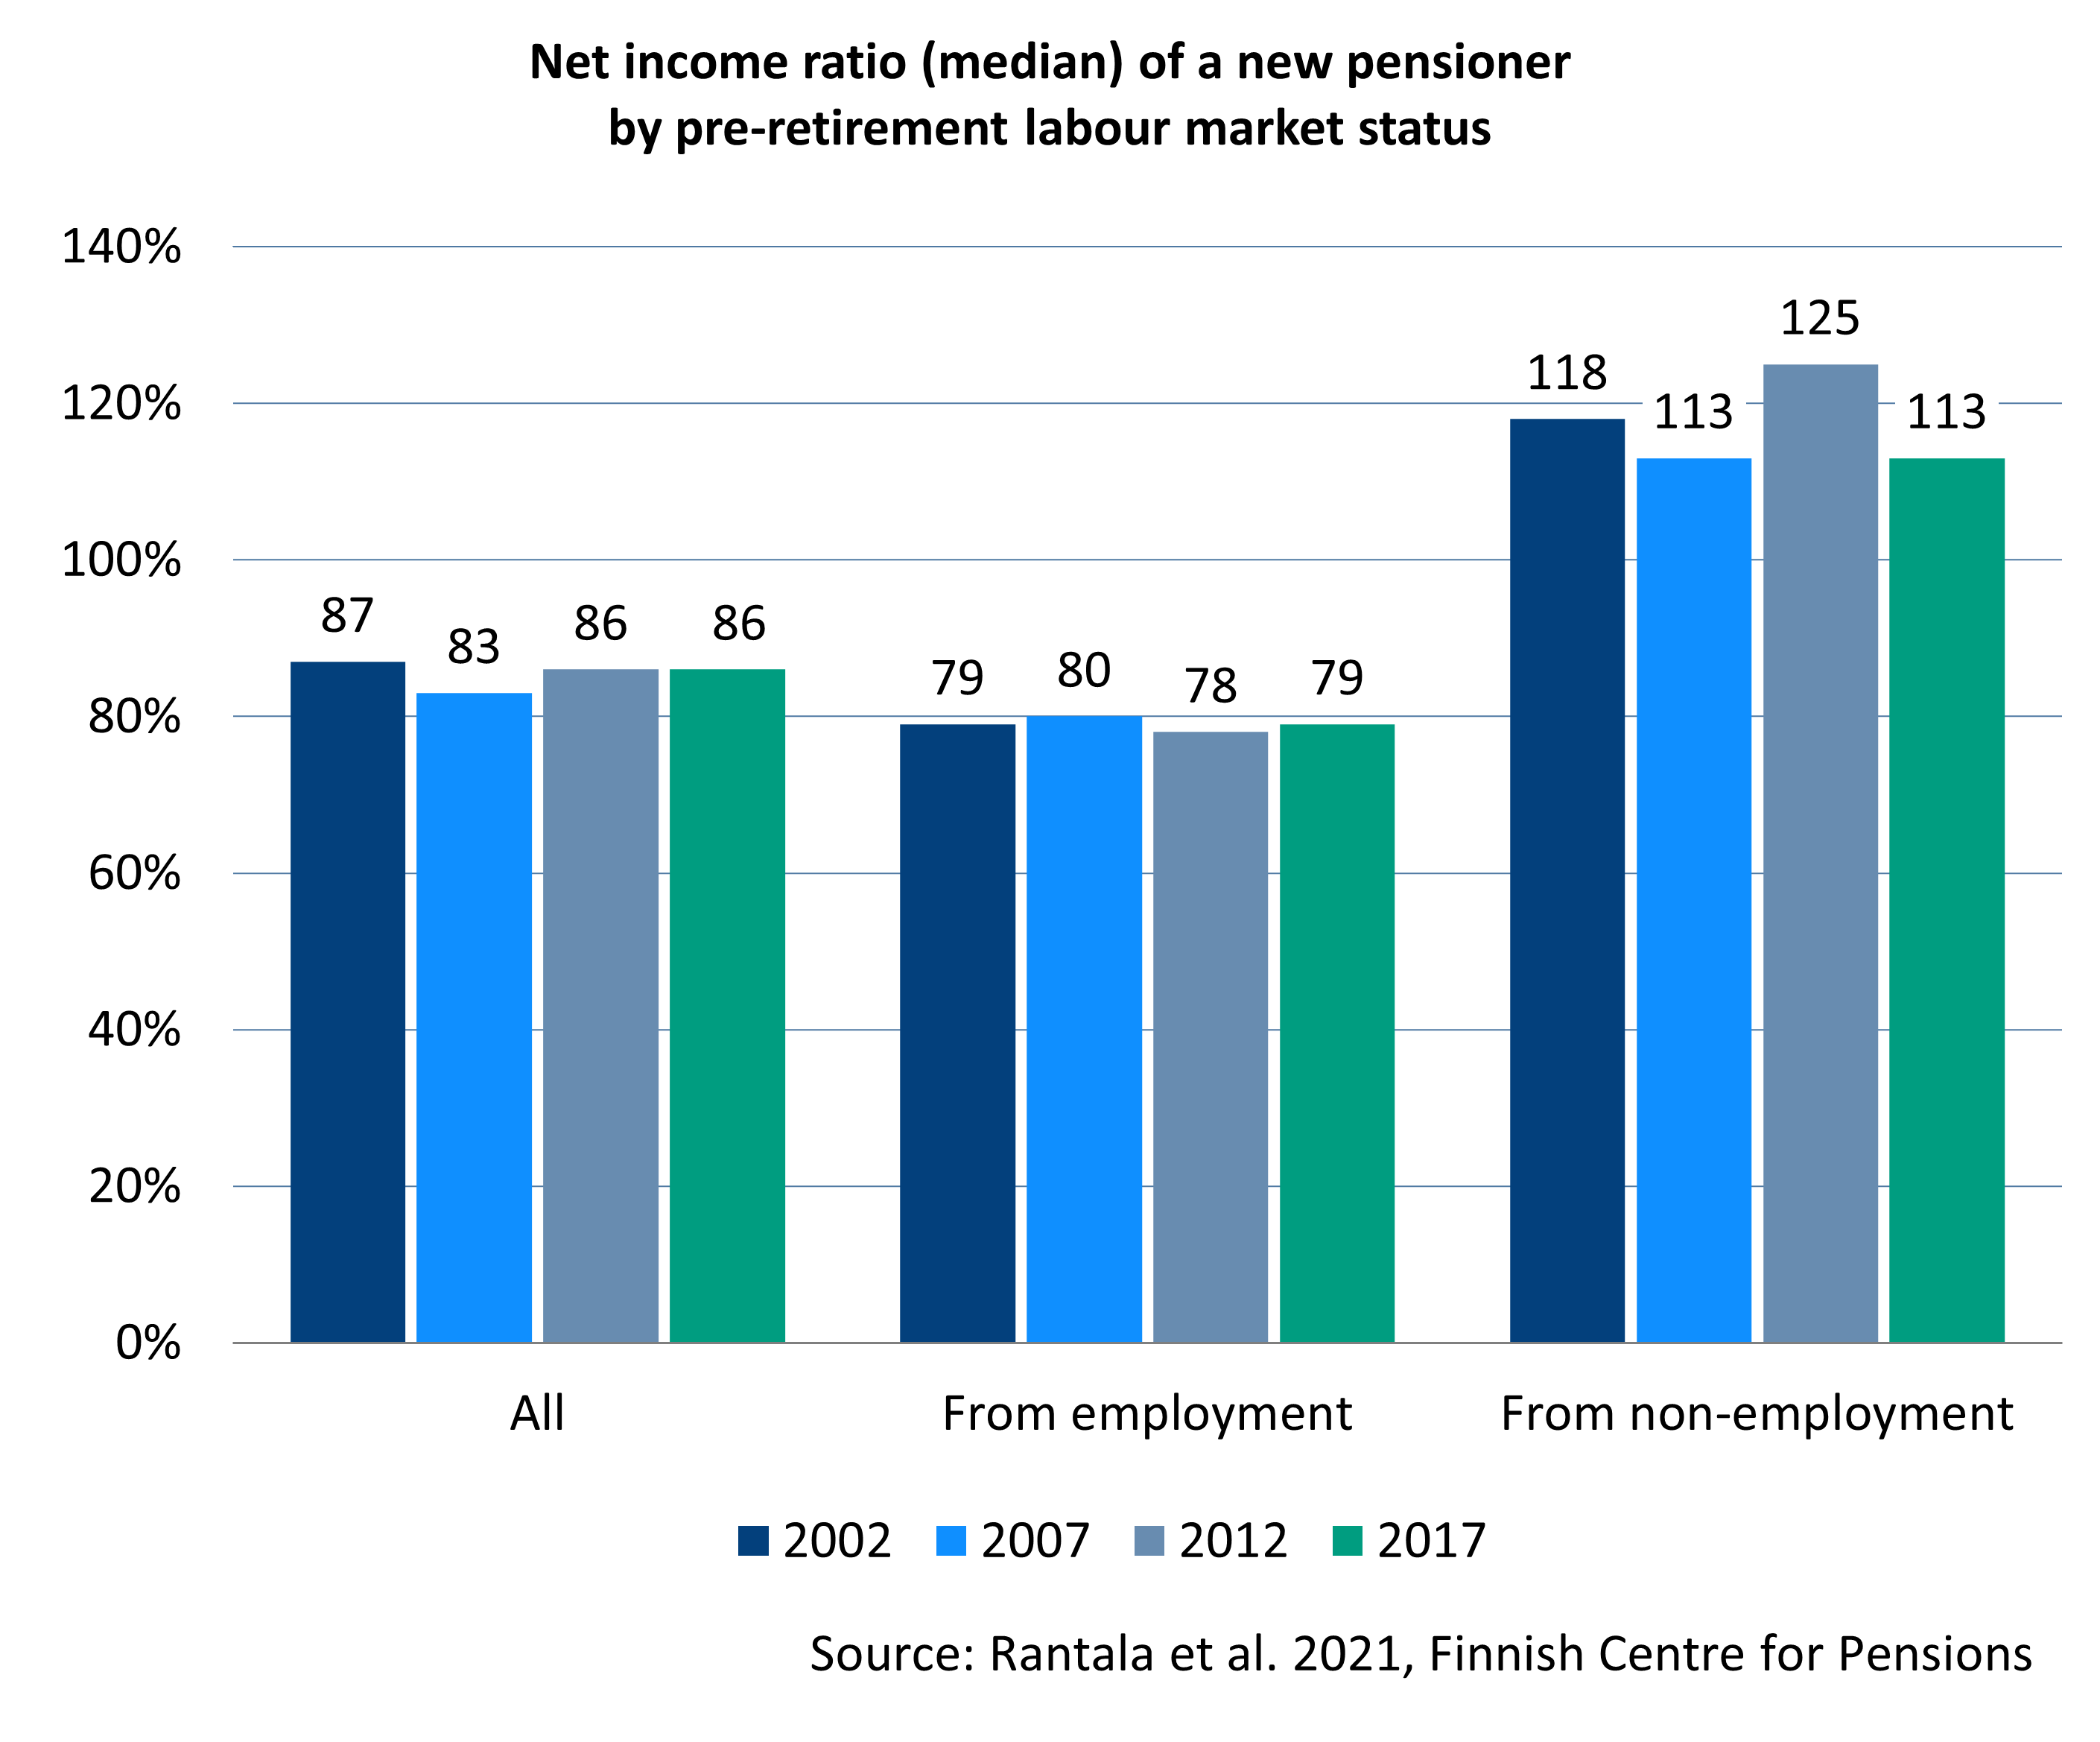
Pensions make up slightly more than two thirds of pensioners’ gross income. Income in retirement reflects the person’s pre-retirement income level. Low earnings lead to a low pension. The person’s previous labour market status also shows in the pension level. For example, the pension level of a person retiring from unemployment tends to be lower than that of a person retiring from working life.
In the 2000s, the net income (gross income less taxes) of all persons who have retired from work or from outside working life have been, on average, 87 per cent of their pre-retirement net income. For those retiring from work, the net ratio has been lower, around 79 per cent on average. The difference is caused by the fact that retirement often improves the net income of the unemployed and others outside the labour force.
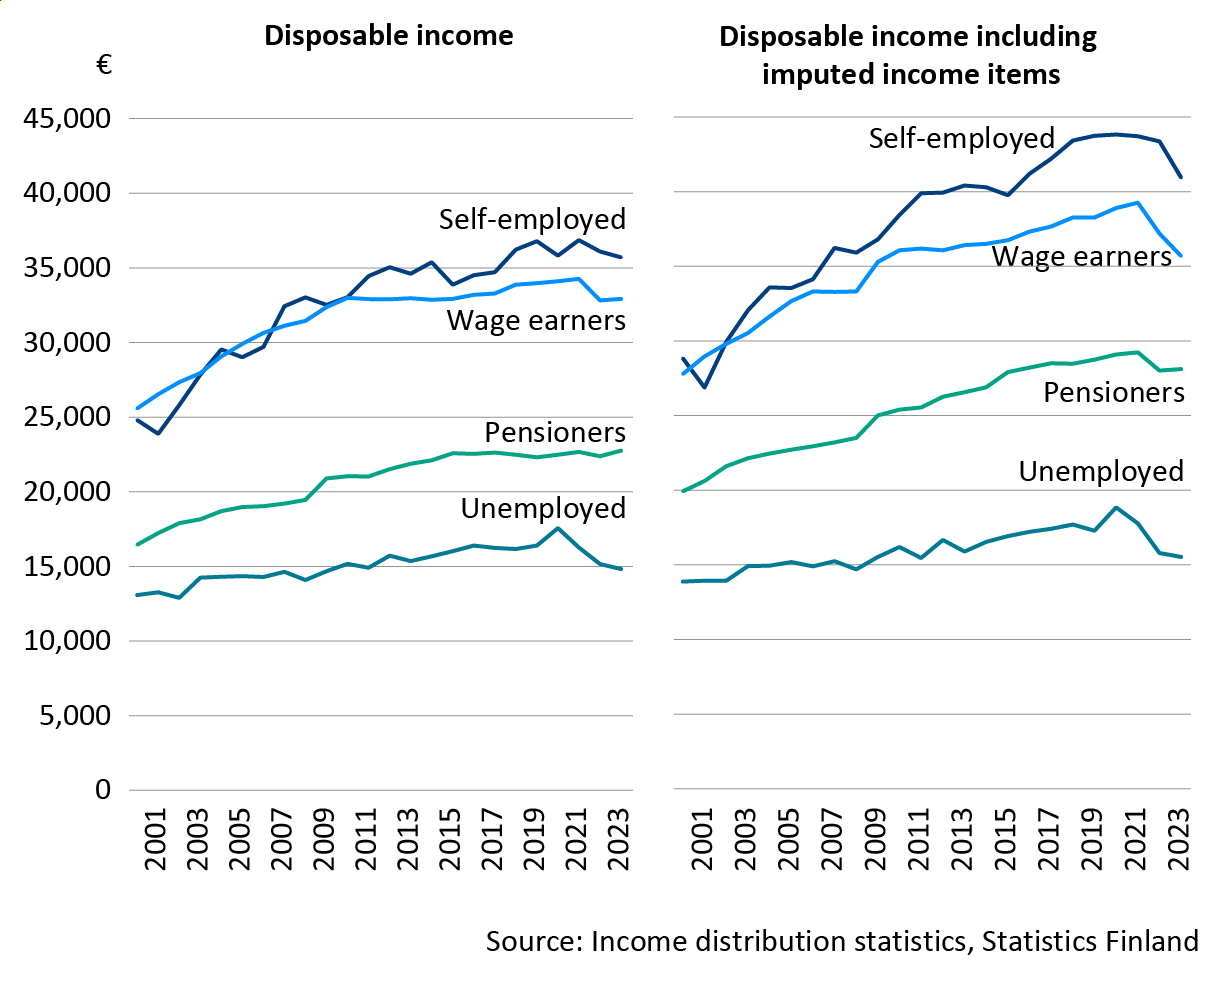
Pensioners’ disposable income is two thirds of the income of wage earners
Pensioners’ disposable income is lower than that of wage earners and the self-employed but higher than that of the unemployed. Throughout the 2000s, pensioners’ disposable income has been around two thirds of wage earners’ income. This difference has remained fairly stable in the last few decades. Compared to the income of the unemployed, the income of pensioners has been an ample one third higher in the 2000s.
On the other hand, if we review the disposable income, which takes also account of the financial gain of home ownership (imputed rent) and other imputed income items, the position of retirees relative to the working population improves.
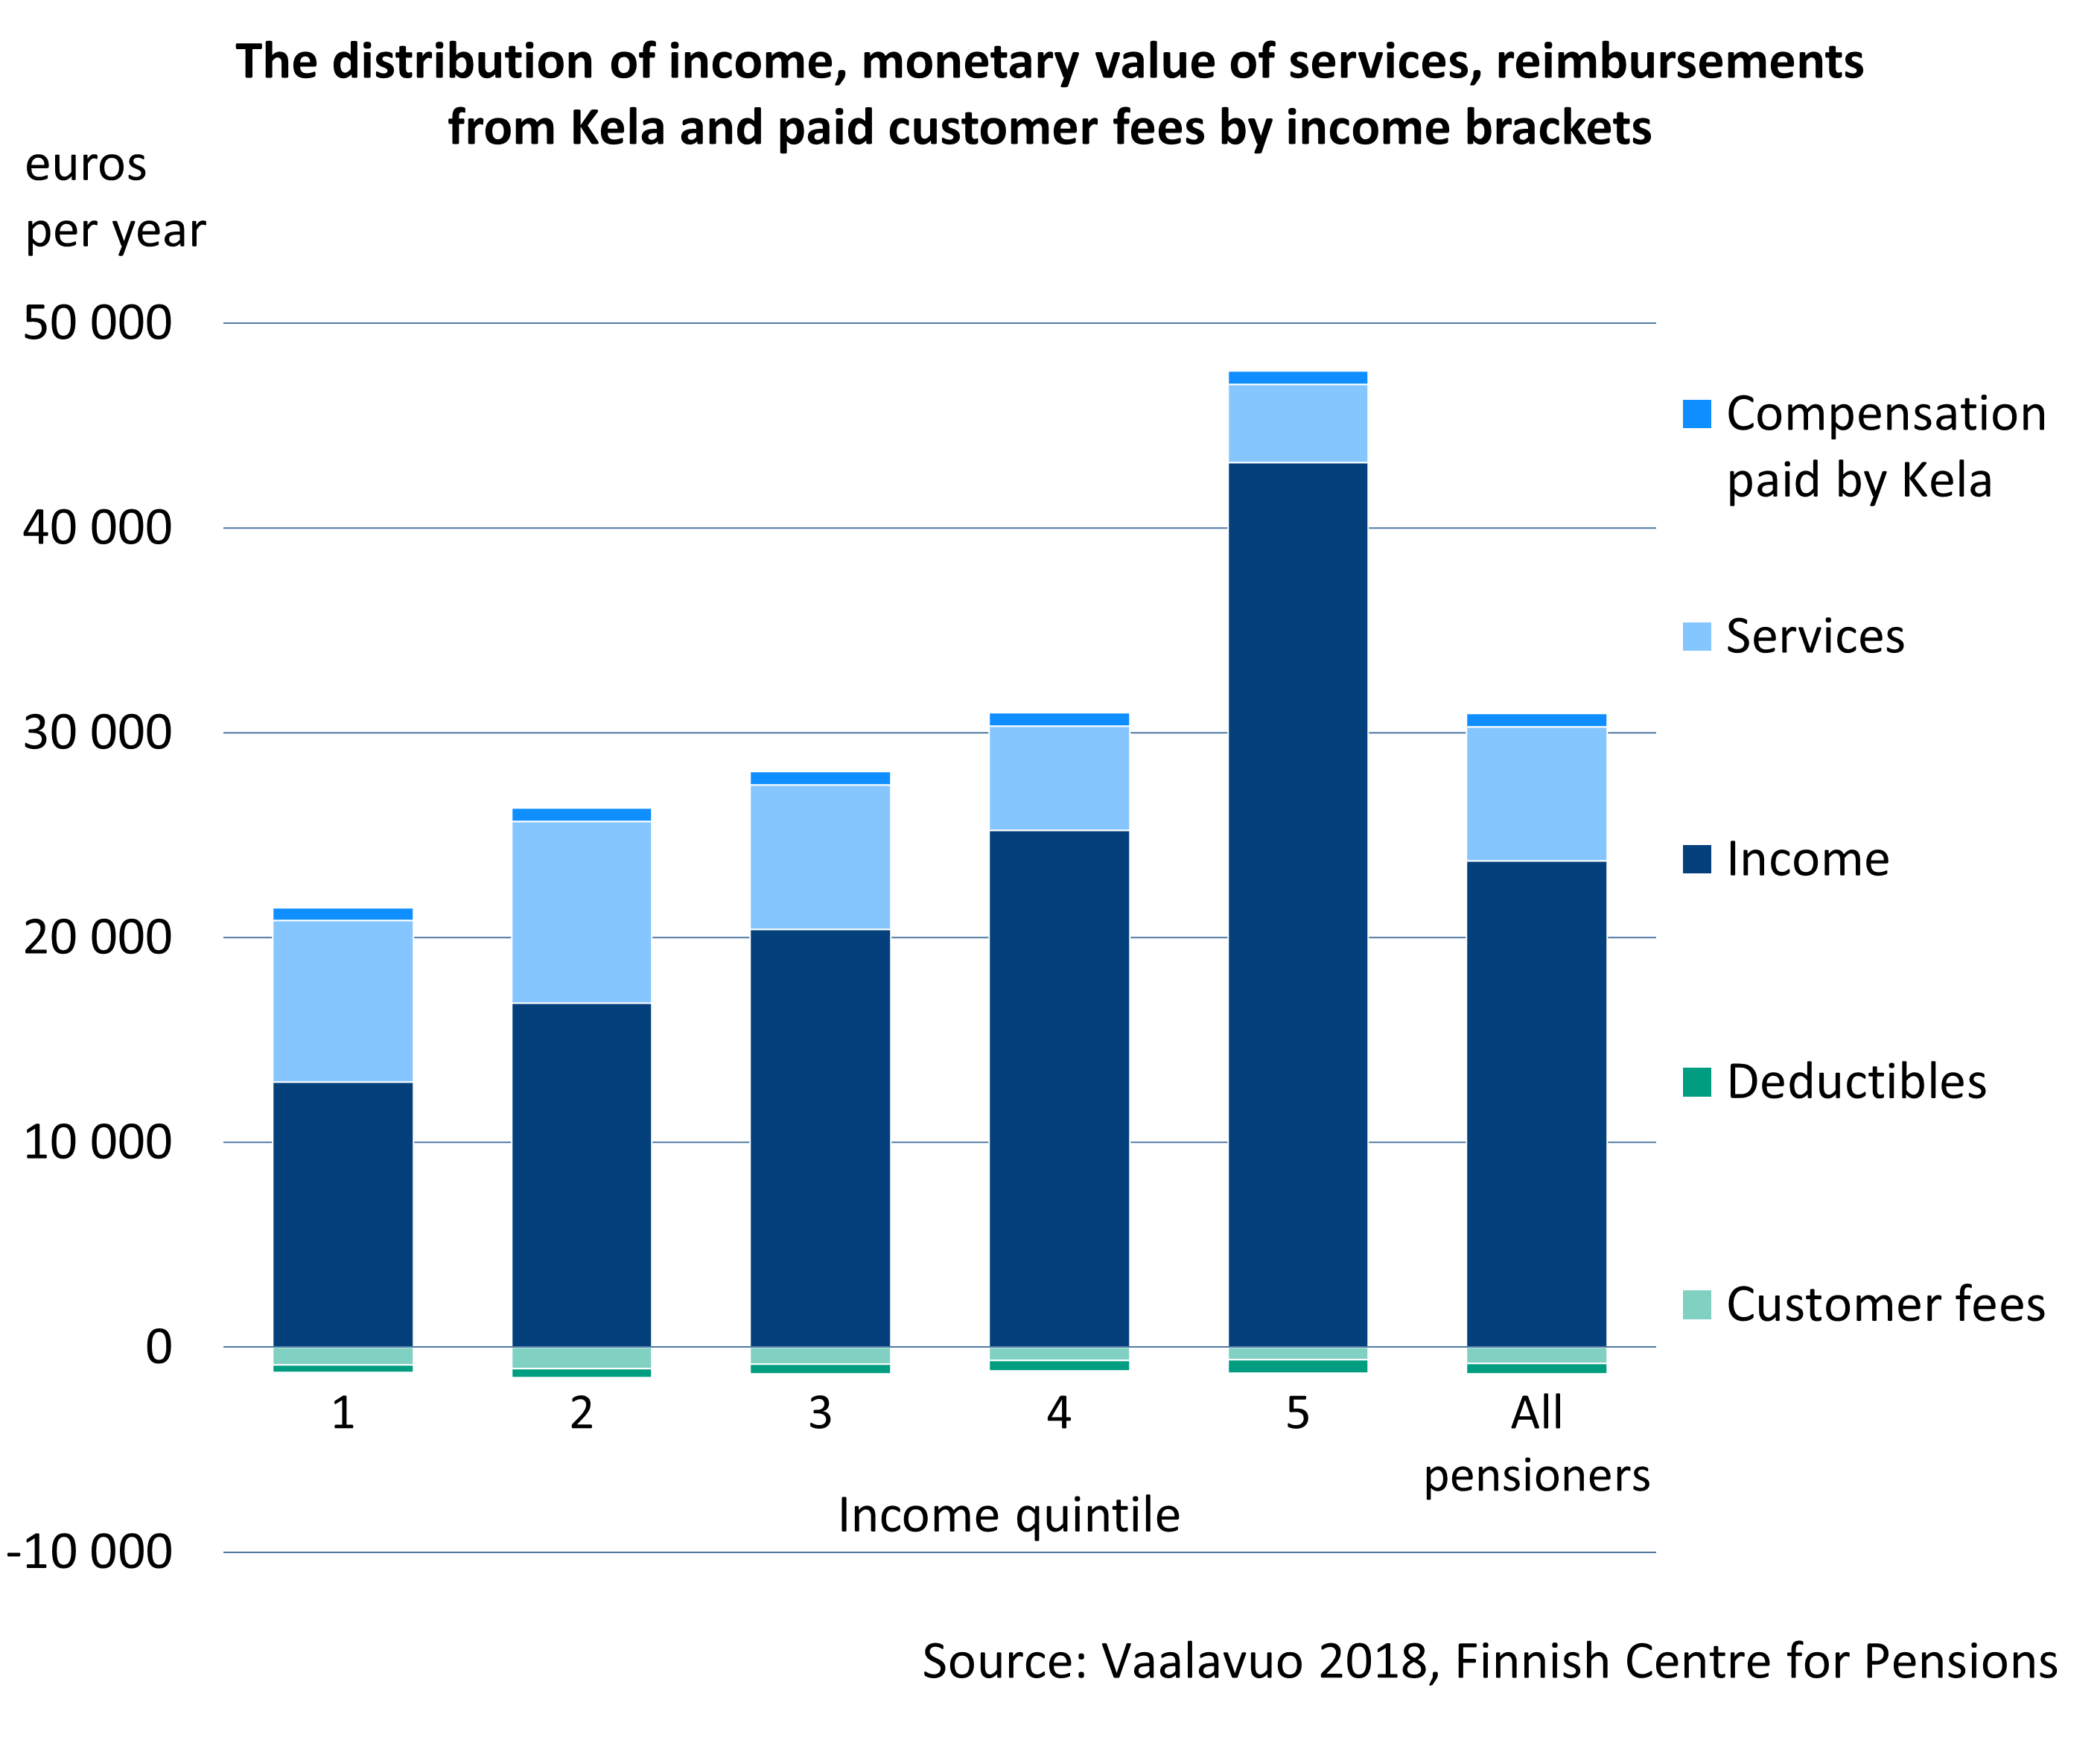
Benefit from public services evens out income gaps between pensioners
Public services support people’s wellbeing. The services can be viewed as part of the public income redistribution system. Low-income pensioners use public social and health services to a larger extend than do high-income pensioners. Relative to the disposable income, the monetary value of the services was particularly significant in the lower income quintile.
Publications:
- Kuivalainen et al. 2022. Pensions and pensioners’ economic wellbeing – Development from 1995 to 2020 (Julkari, summary in English)
- Rantala 2020. Studies on the dynamics of low income and economic well-being of pensioners in Finland in 1995–2014 (Julkari, summary in English)
- Rantala et al. 2021. How does net income change at retirement? A review of changes in net income ratio from 2002 to 2017 (Julkari, summary in English)
- Vaalavuo 2018. The Impact of Social and Health Care Services on Retiree’s Income (Julkari, summary in English)
Pensioners’ income can also be reviewed from the point of view of consumption, assets and perceived economic welfare. This gives a more comprehensive picture of pensioners’ financial situation. Reviewing by income only does not give information on, for example, what consumption level the income allows for or how adequate the income is perceived to be.
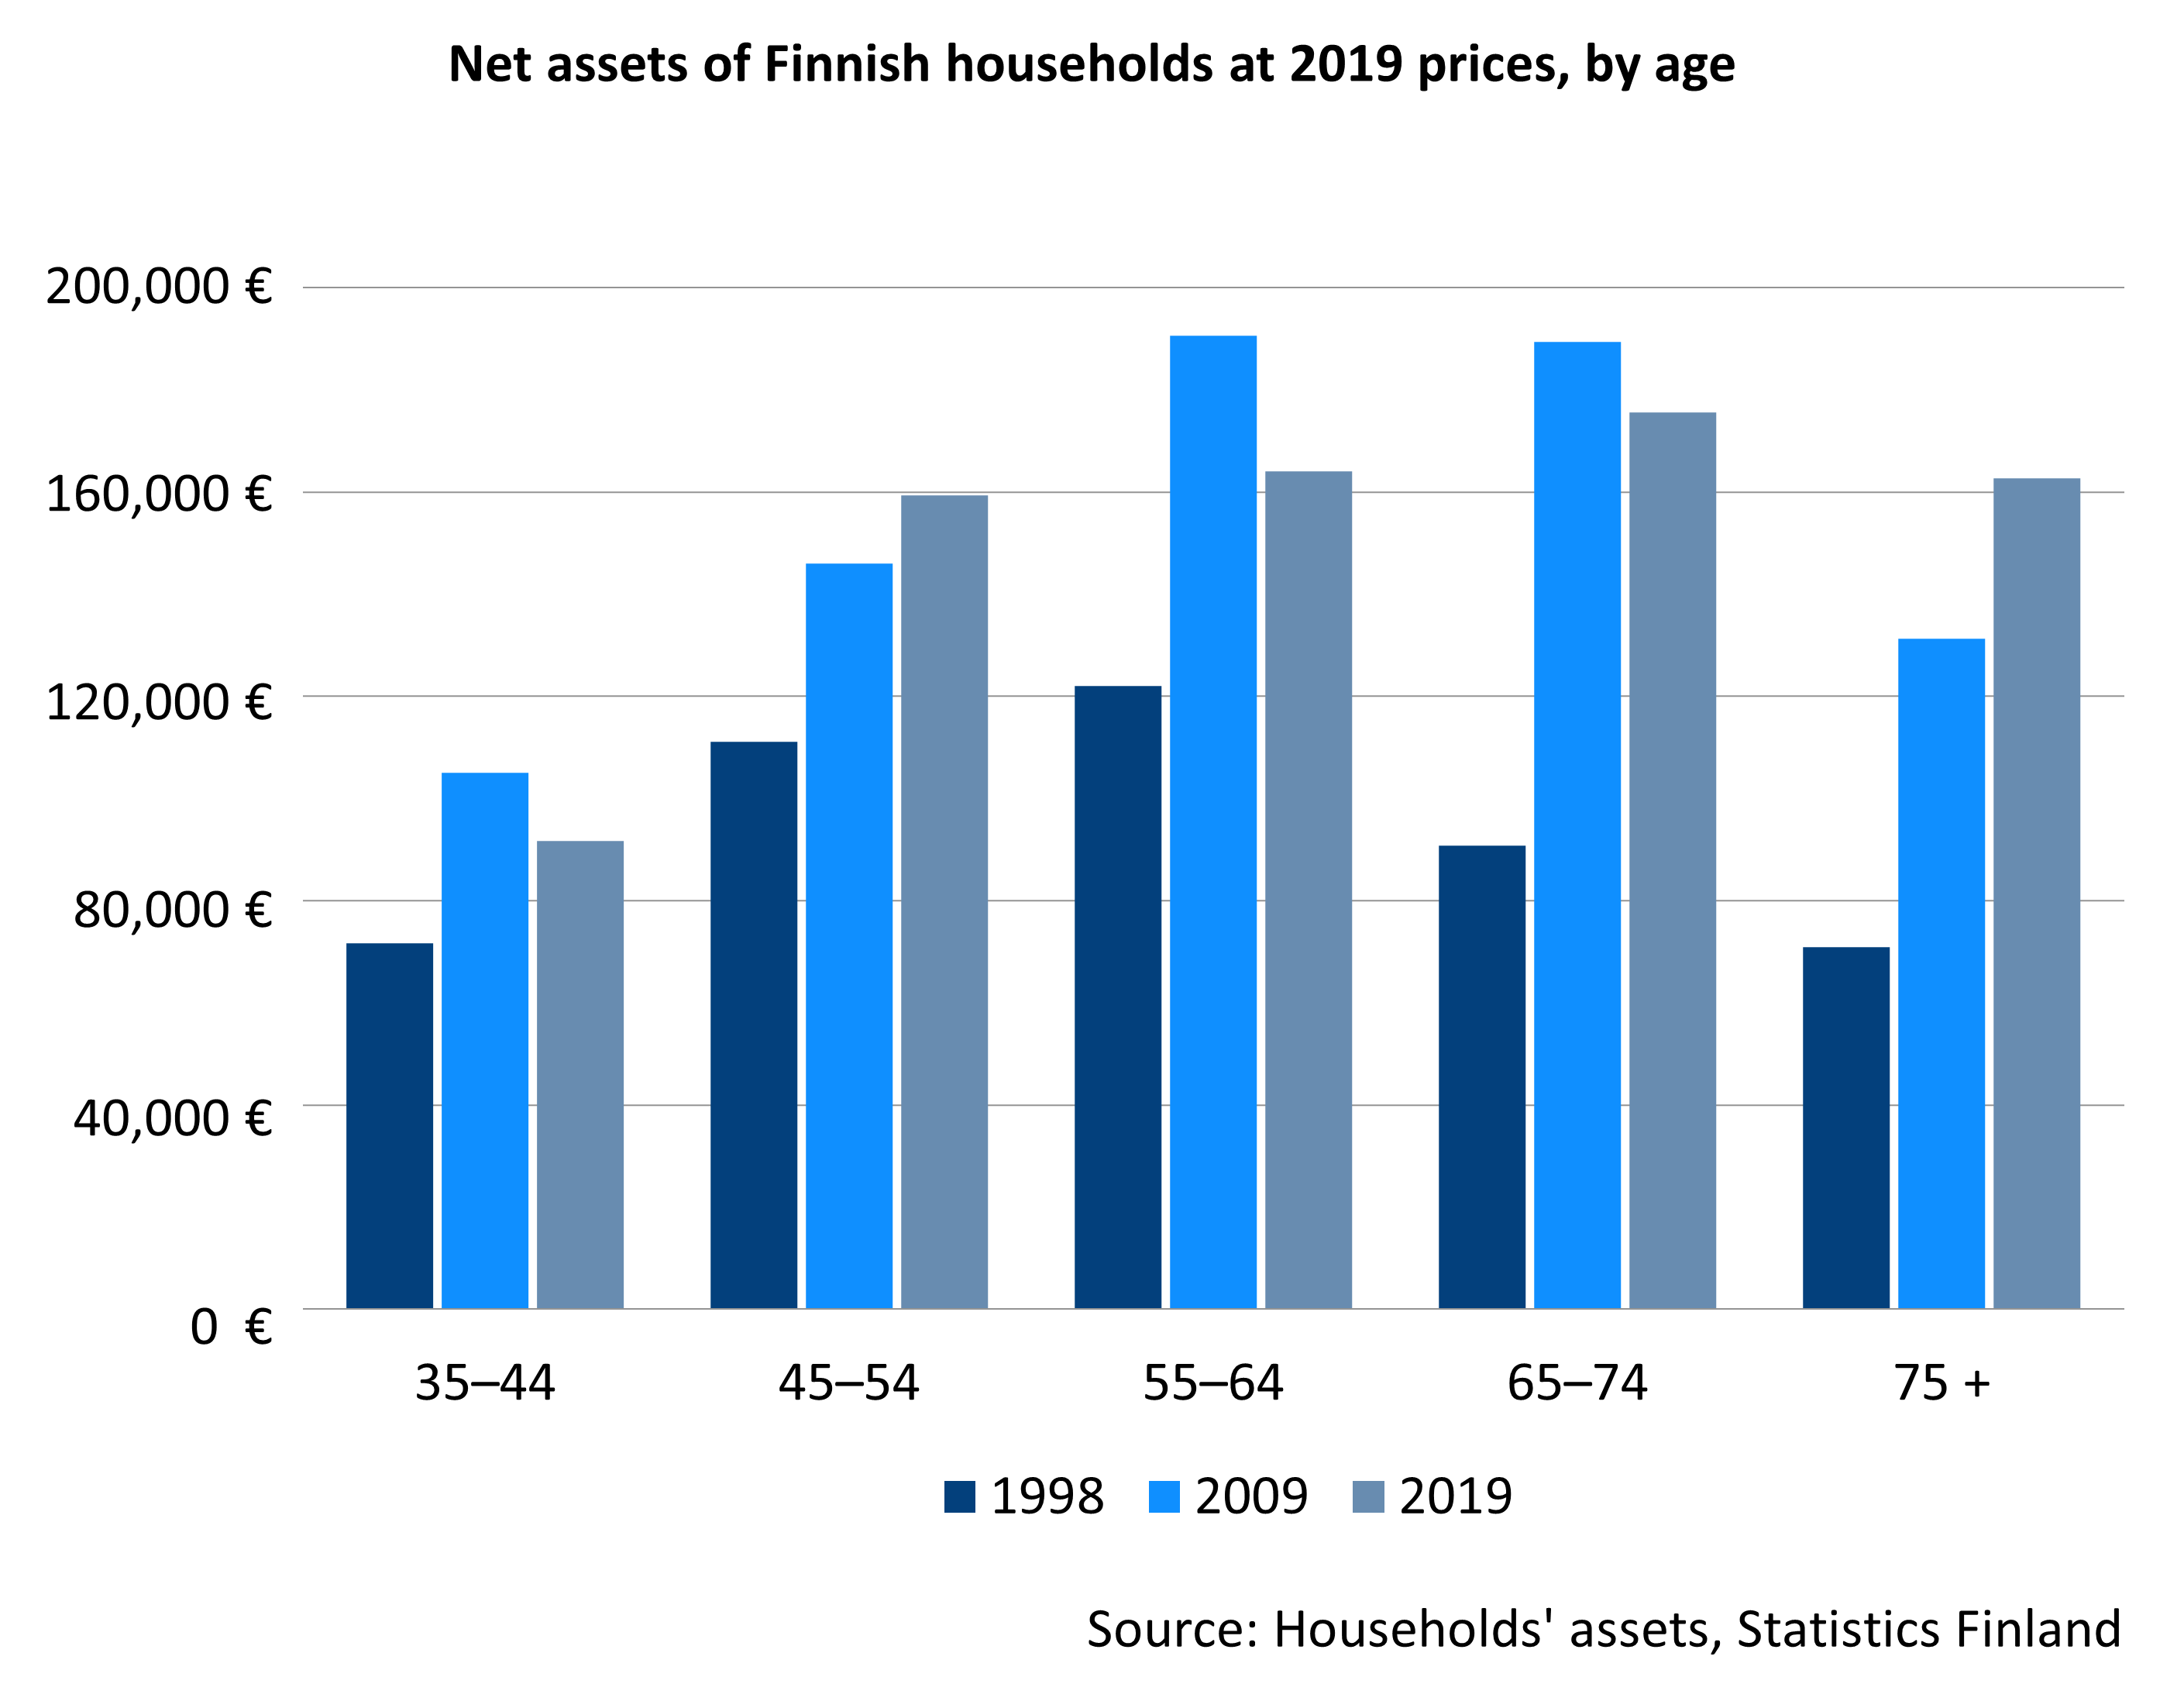
Savings and assets can supplement income and act as a buffer against unexpected expenses. Wealth typically accumulate with age through debt repayment and other forms of saving. The value of existing assets can also increase over time. Assets can also be acquired through inheritance. The assets of pensioners have increased, especially as the large post-war baby boom generations have reached retirement age. The net assets of Finnish households are now fairly evenly distributed among households headed by people aged 45 and older.
Publications:
- Ahonen 2022. Vanhuuseläkeläiskotitalouksien varallisuus ja velat vuonna 2020 [Wealth and debts of pensioner households in 2020, in Pensions and pensioners’ economic wellbeing – Development from 1995 to 2020] (Julkari)
- Ahonen 2023. Suomalaisten vanhuuseläkeläisten varallisuus ja taloudellinen tyytyväisyys [Finnish pensioners’ assets and financial satisfaction] (Julkari)
In the 2000s century, the consumption habits of pensioners have increasingly mirrored those of the working-age population. In particular, the total consumption expenditure of households headed by people aged 75 and over has increased significantly over the past decade. In 2012, for example, the average total consumption expenditure of households headed by people aged 75–84 was around 60 per cent of that of households headed by people aged 45–54. By 2022, this had risen to 85 per cent.
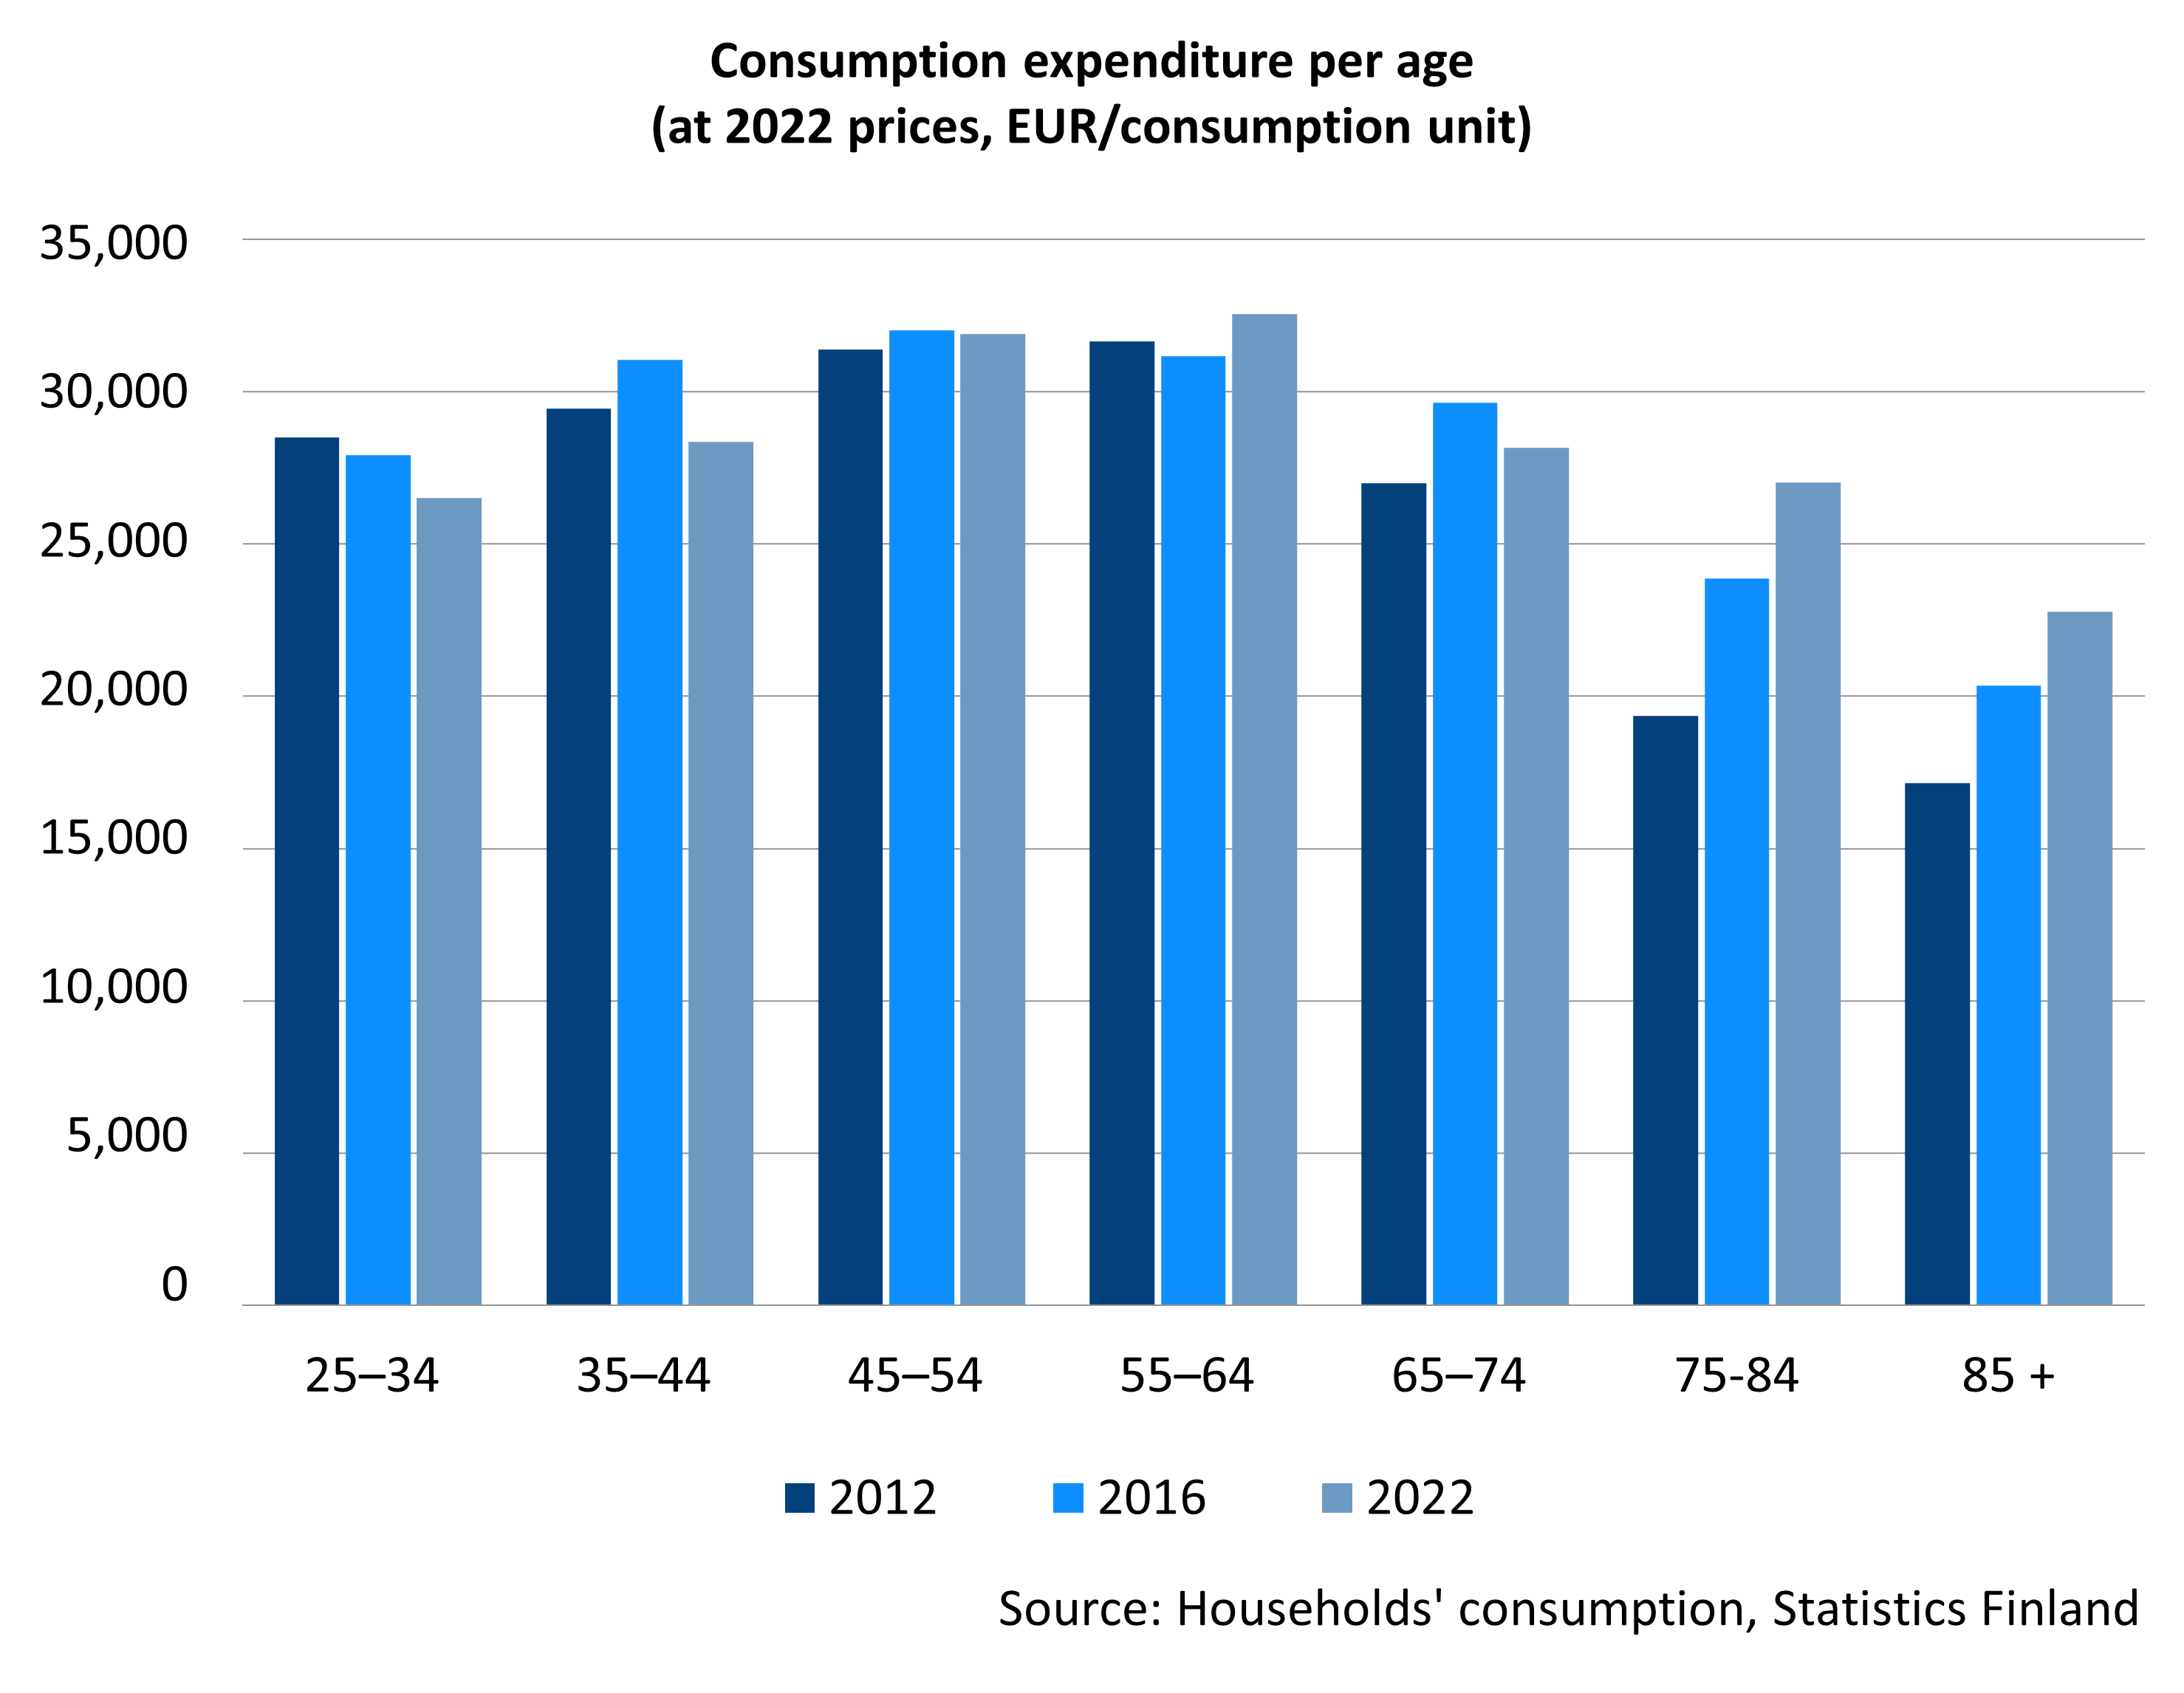
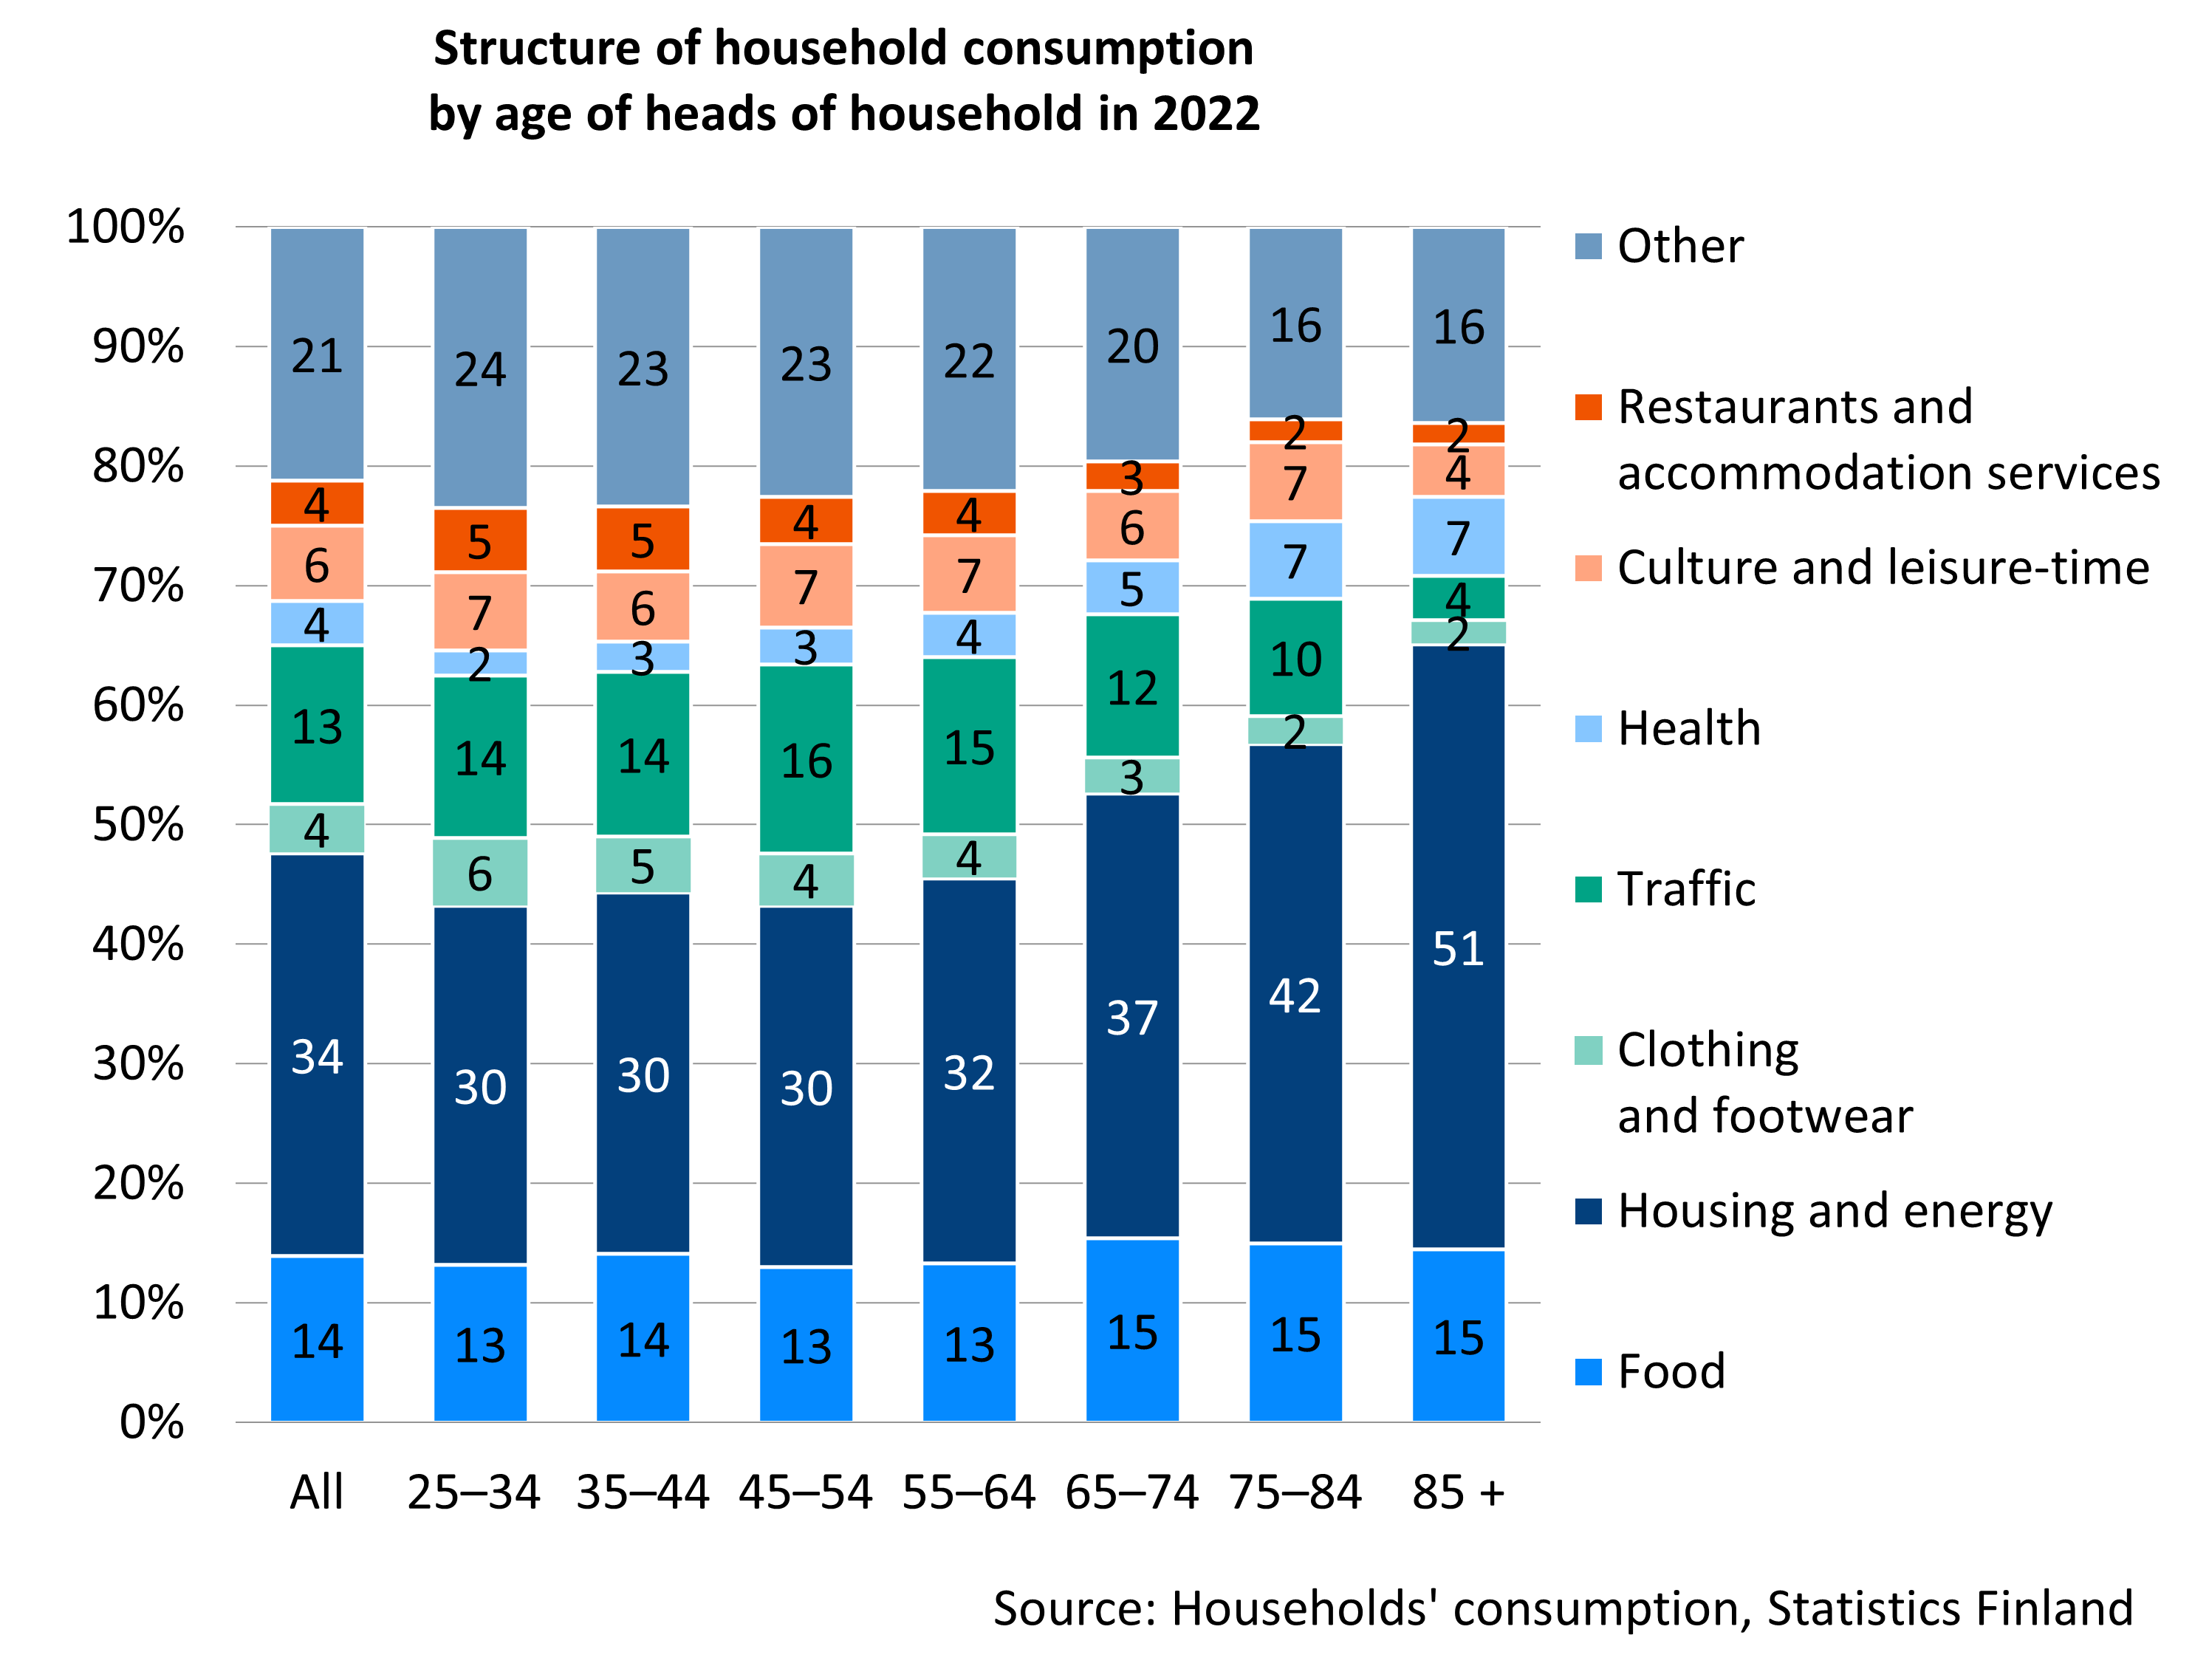
Housing expenses form the largest consumption expenditure item in all age groups. Housing expenses make up a particularly high share for the older population: in 2022, they formed more than 40 per cent of the total expenditure for those aged between 75 and 84 years and 50 per cent of those aged 85 and over. Health care expenses are also highlighted in the consumption of the older age groups. In contrast, the share of expenses for leisure time, restaurant and hotel services, as well as transportation and communication is clearly lower for this age group than for the younger ones.
Livelihood most often perceived easy, and few bargain often on consumption
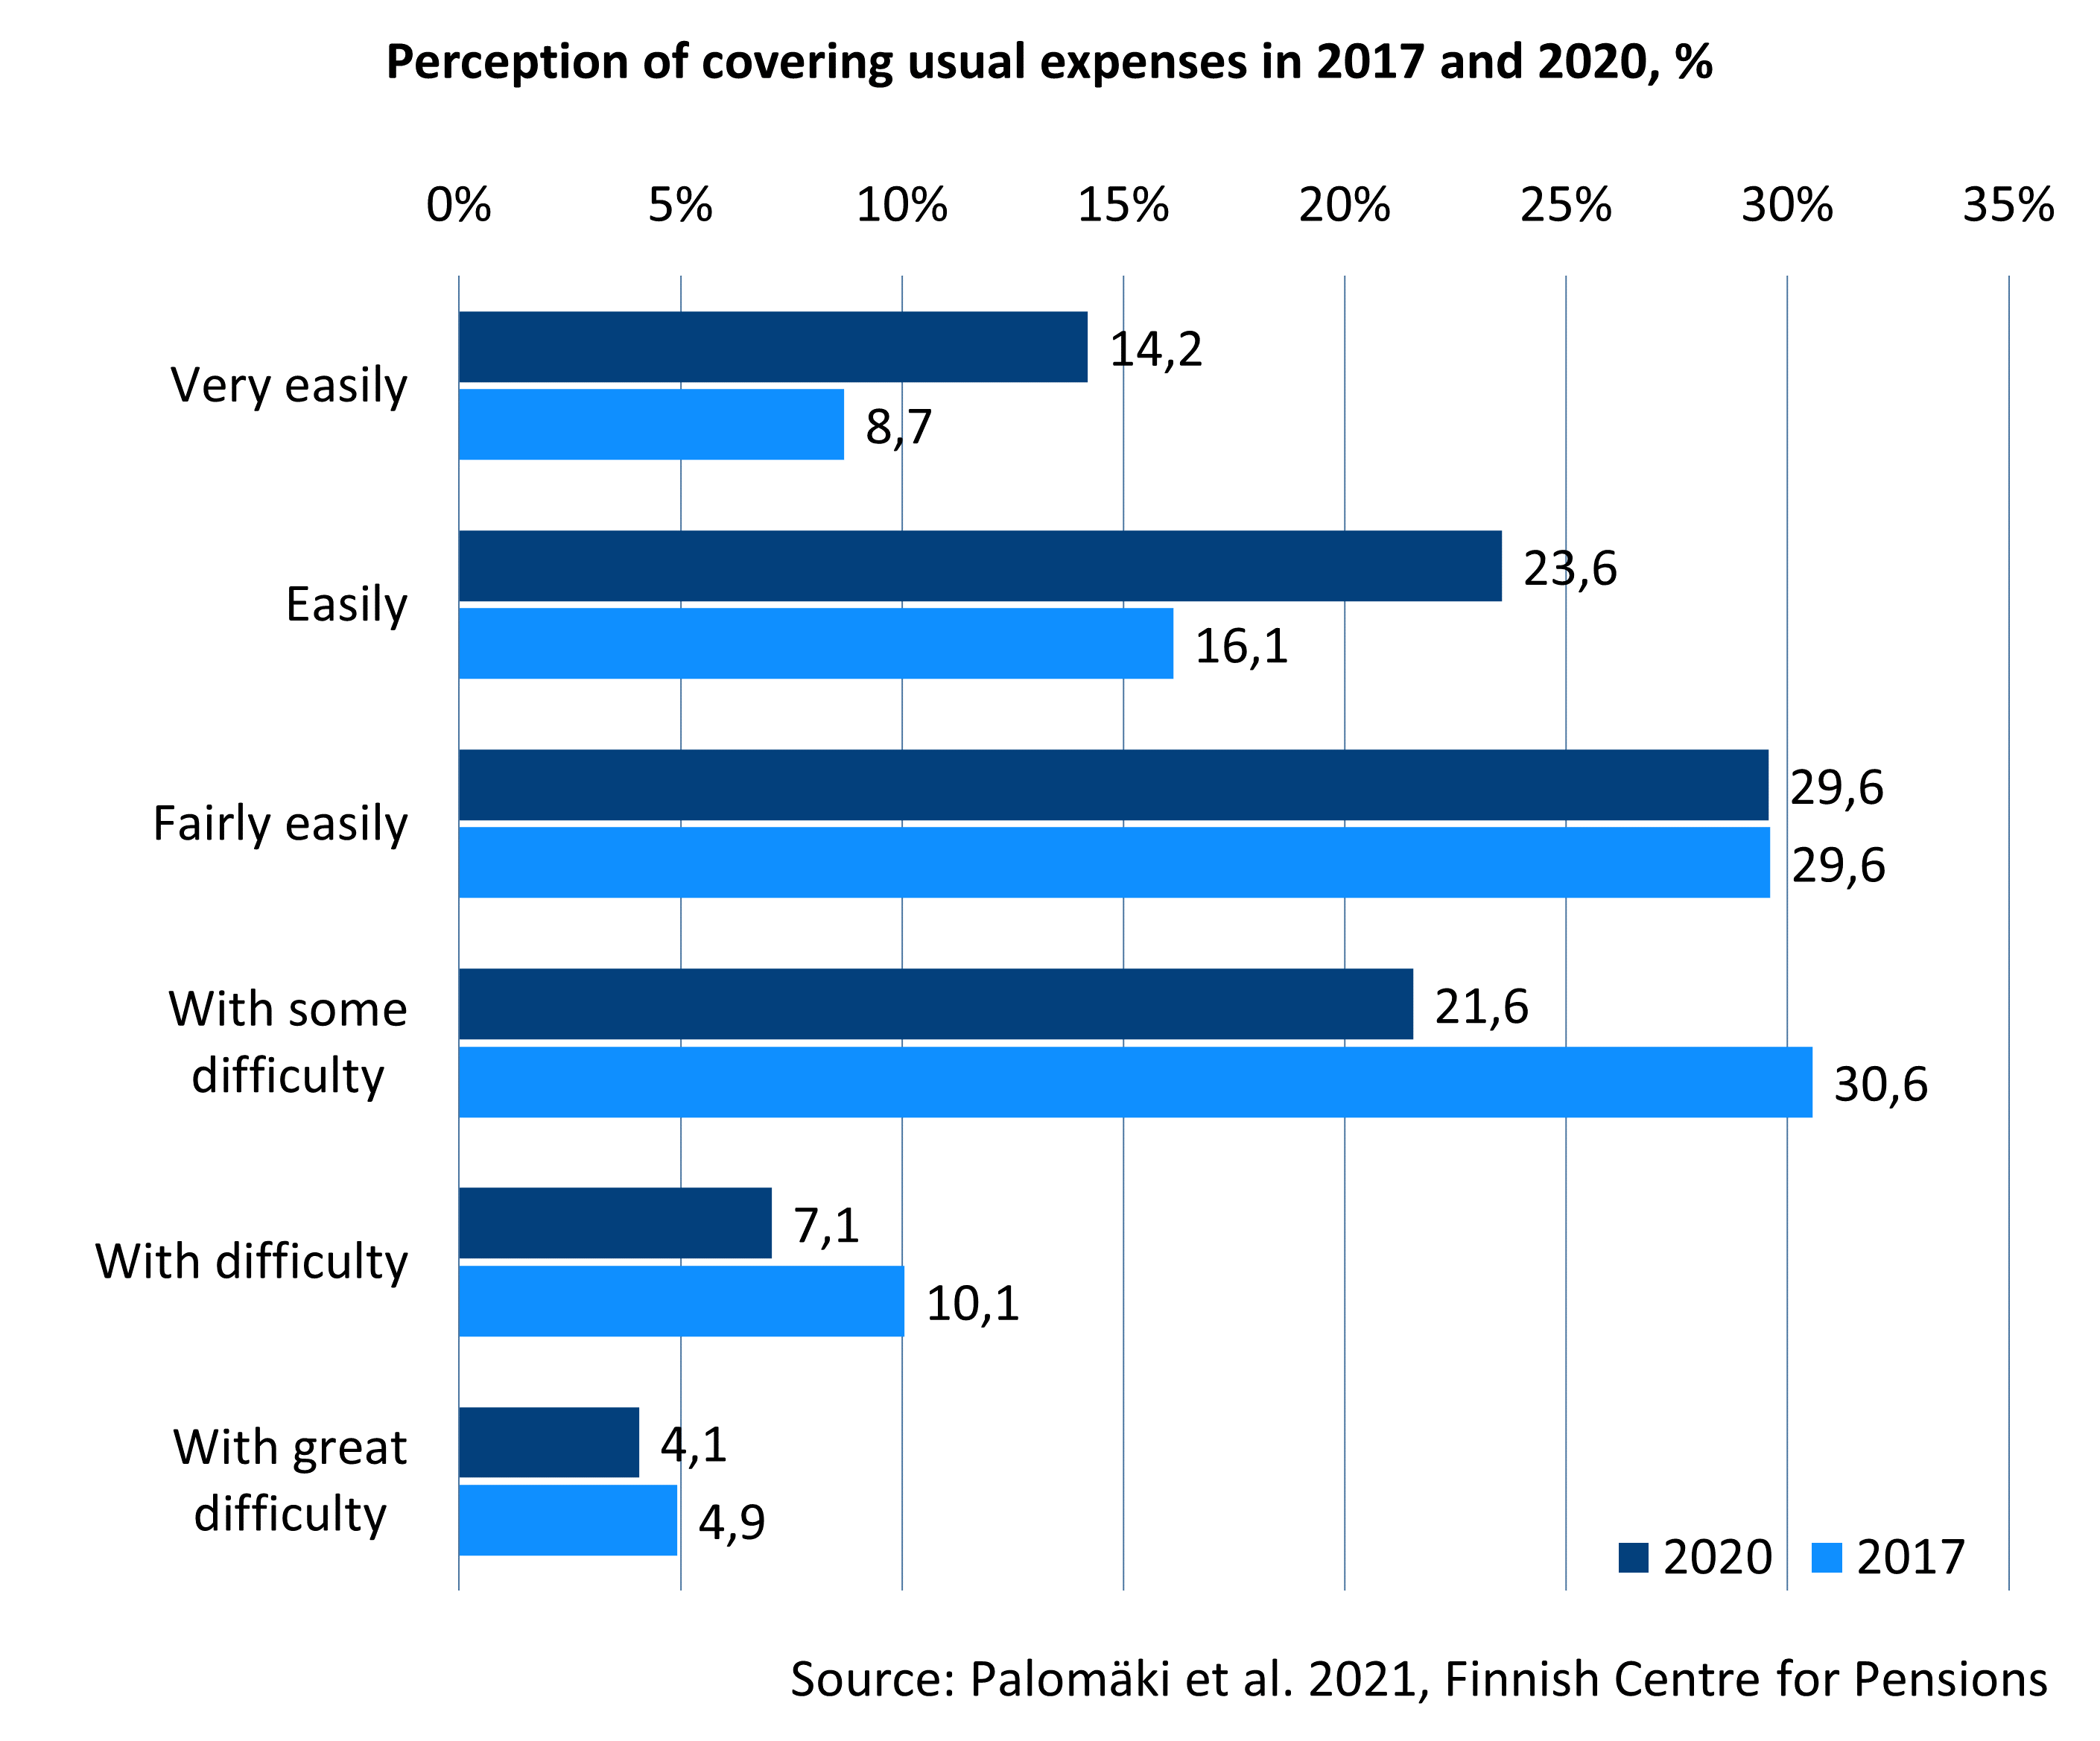
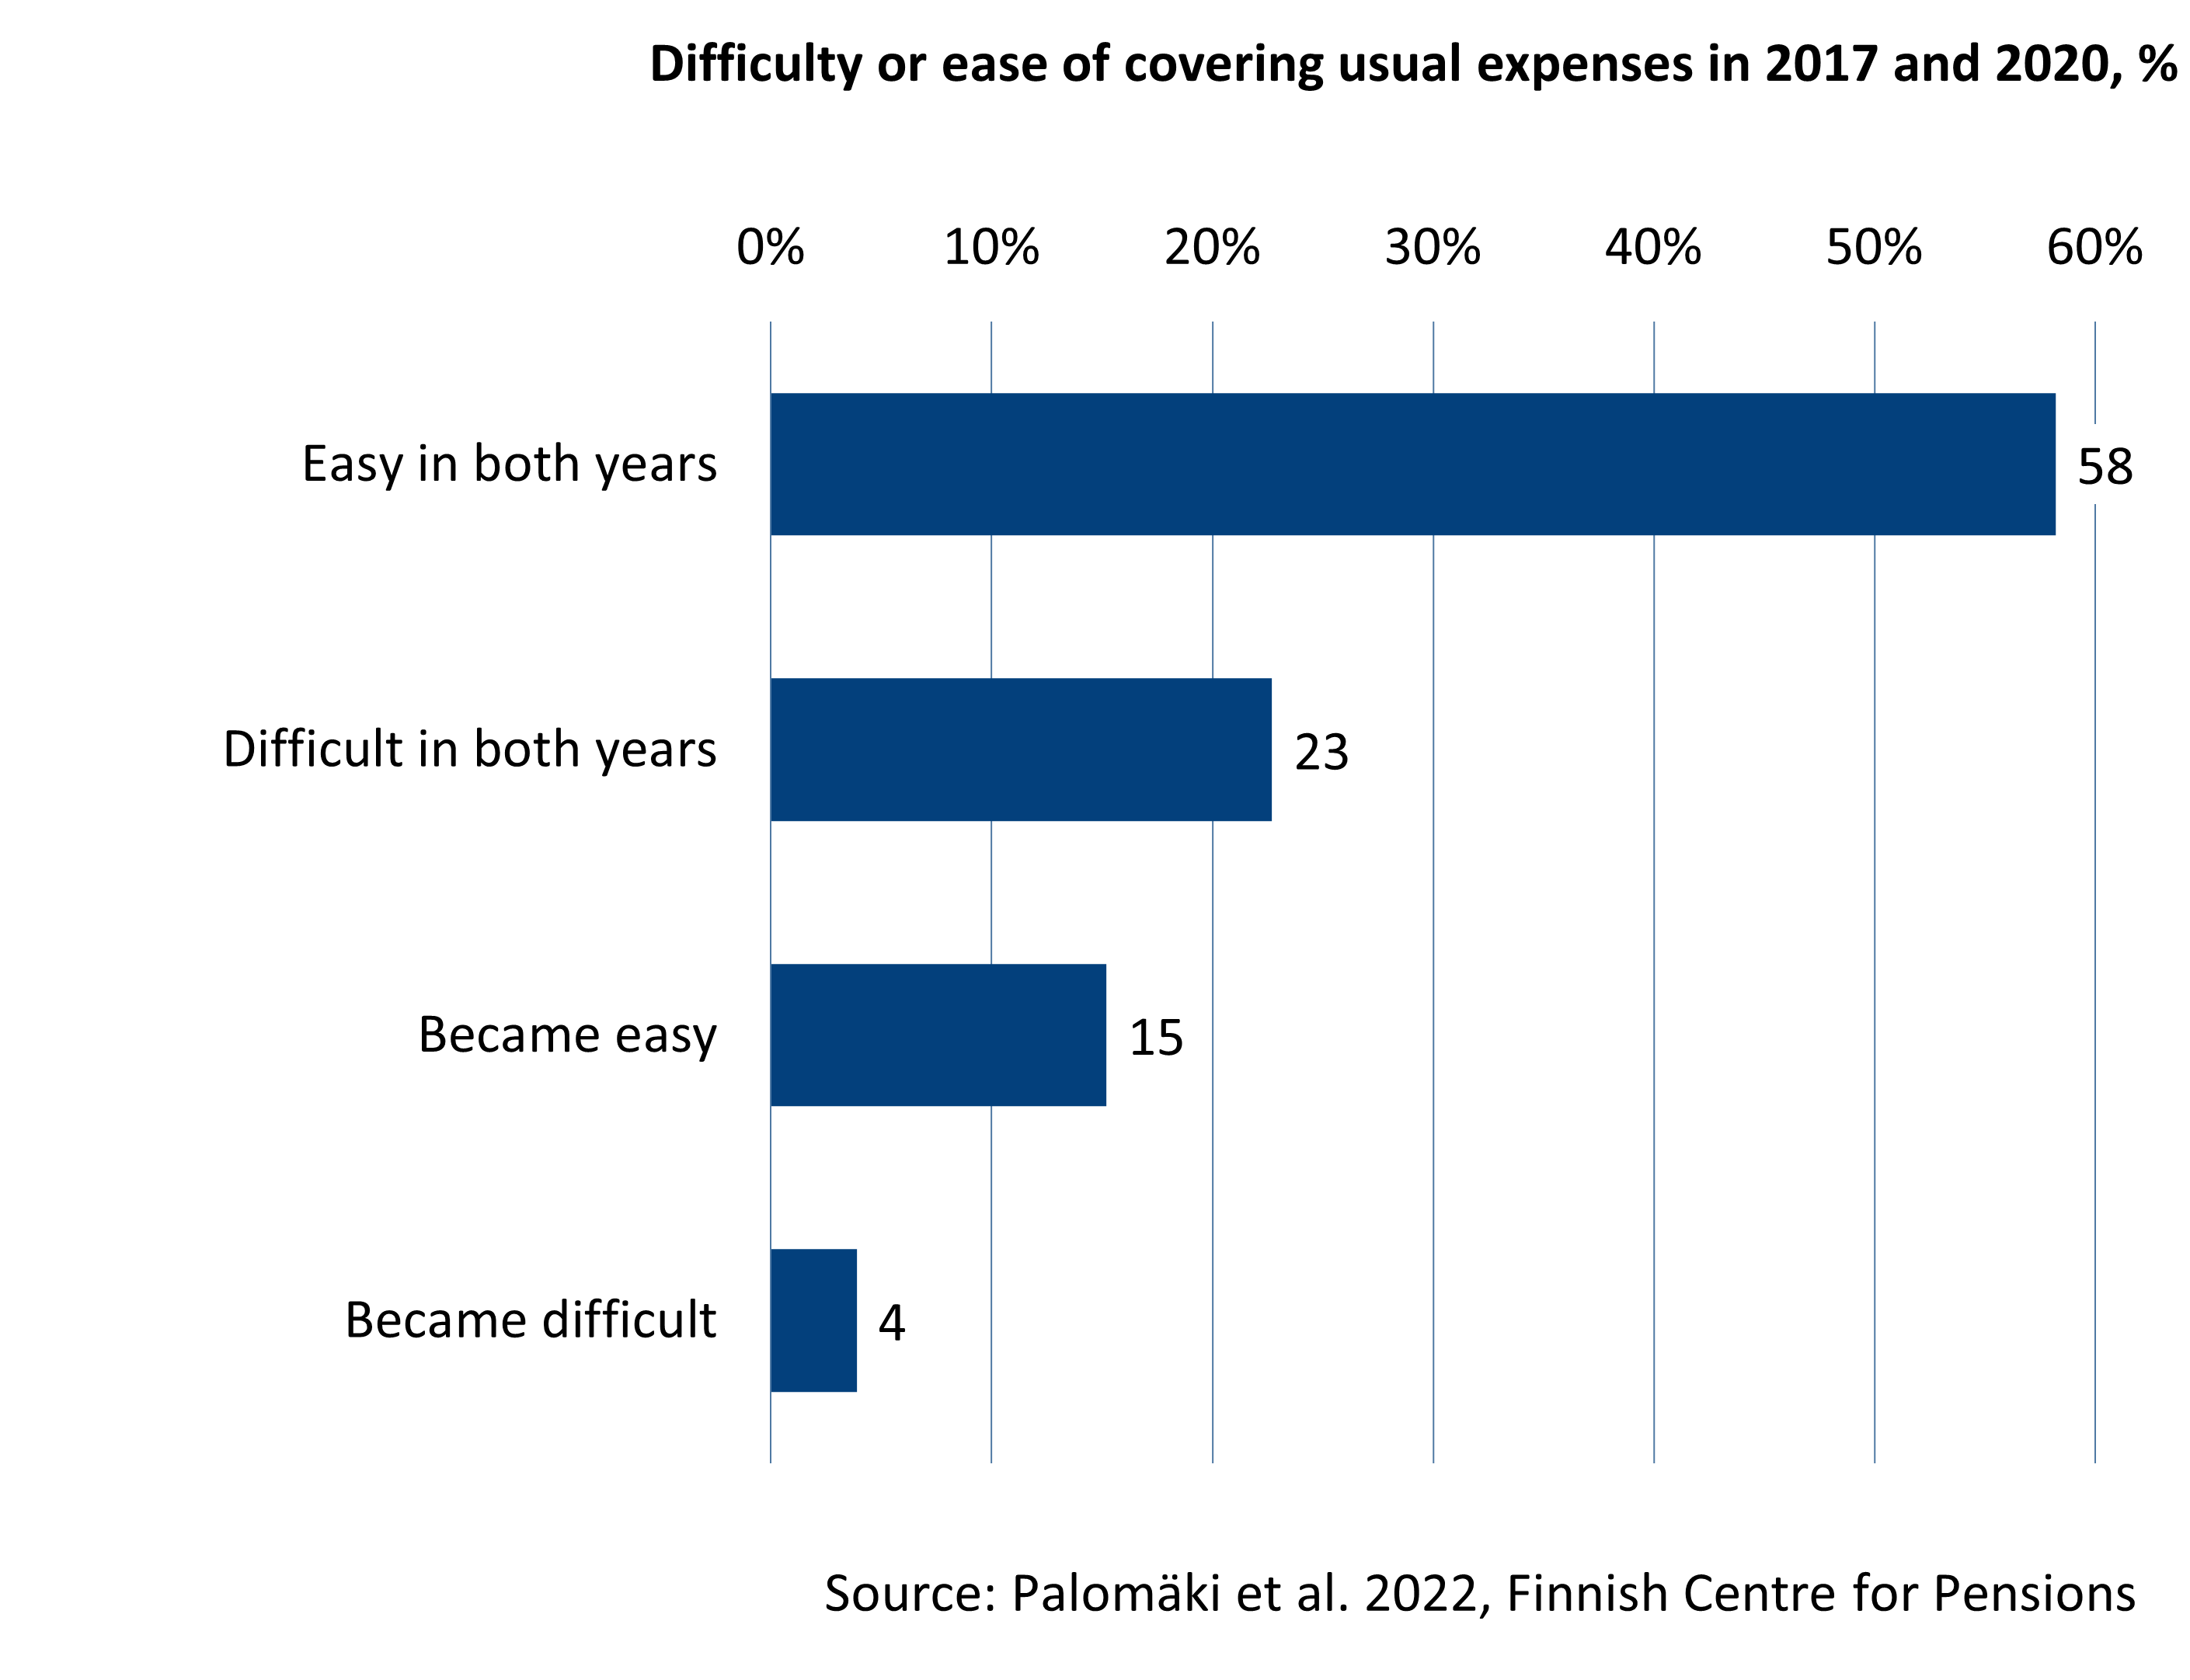
In 2020, most pensioners found it at least fairly easy to cover their expenses, but around one third reported at least some degree of financial strain. Most of the difficulties were minor. Around 10 per cent of pensioners reported more serious financial strain. Pensioners experienced financial strain less often in 2020 than in 2017. Financial strain was experienced more often than average among people who felt in poor health, belong to the lowest income third, live in rental housing, live alone, and those under 65 years who are mainly on a disability pension.
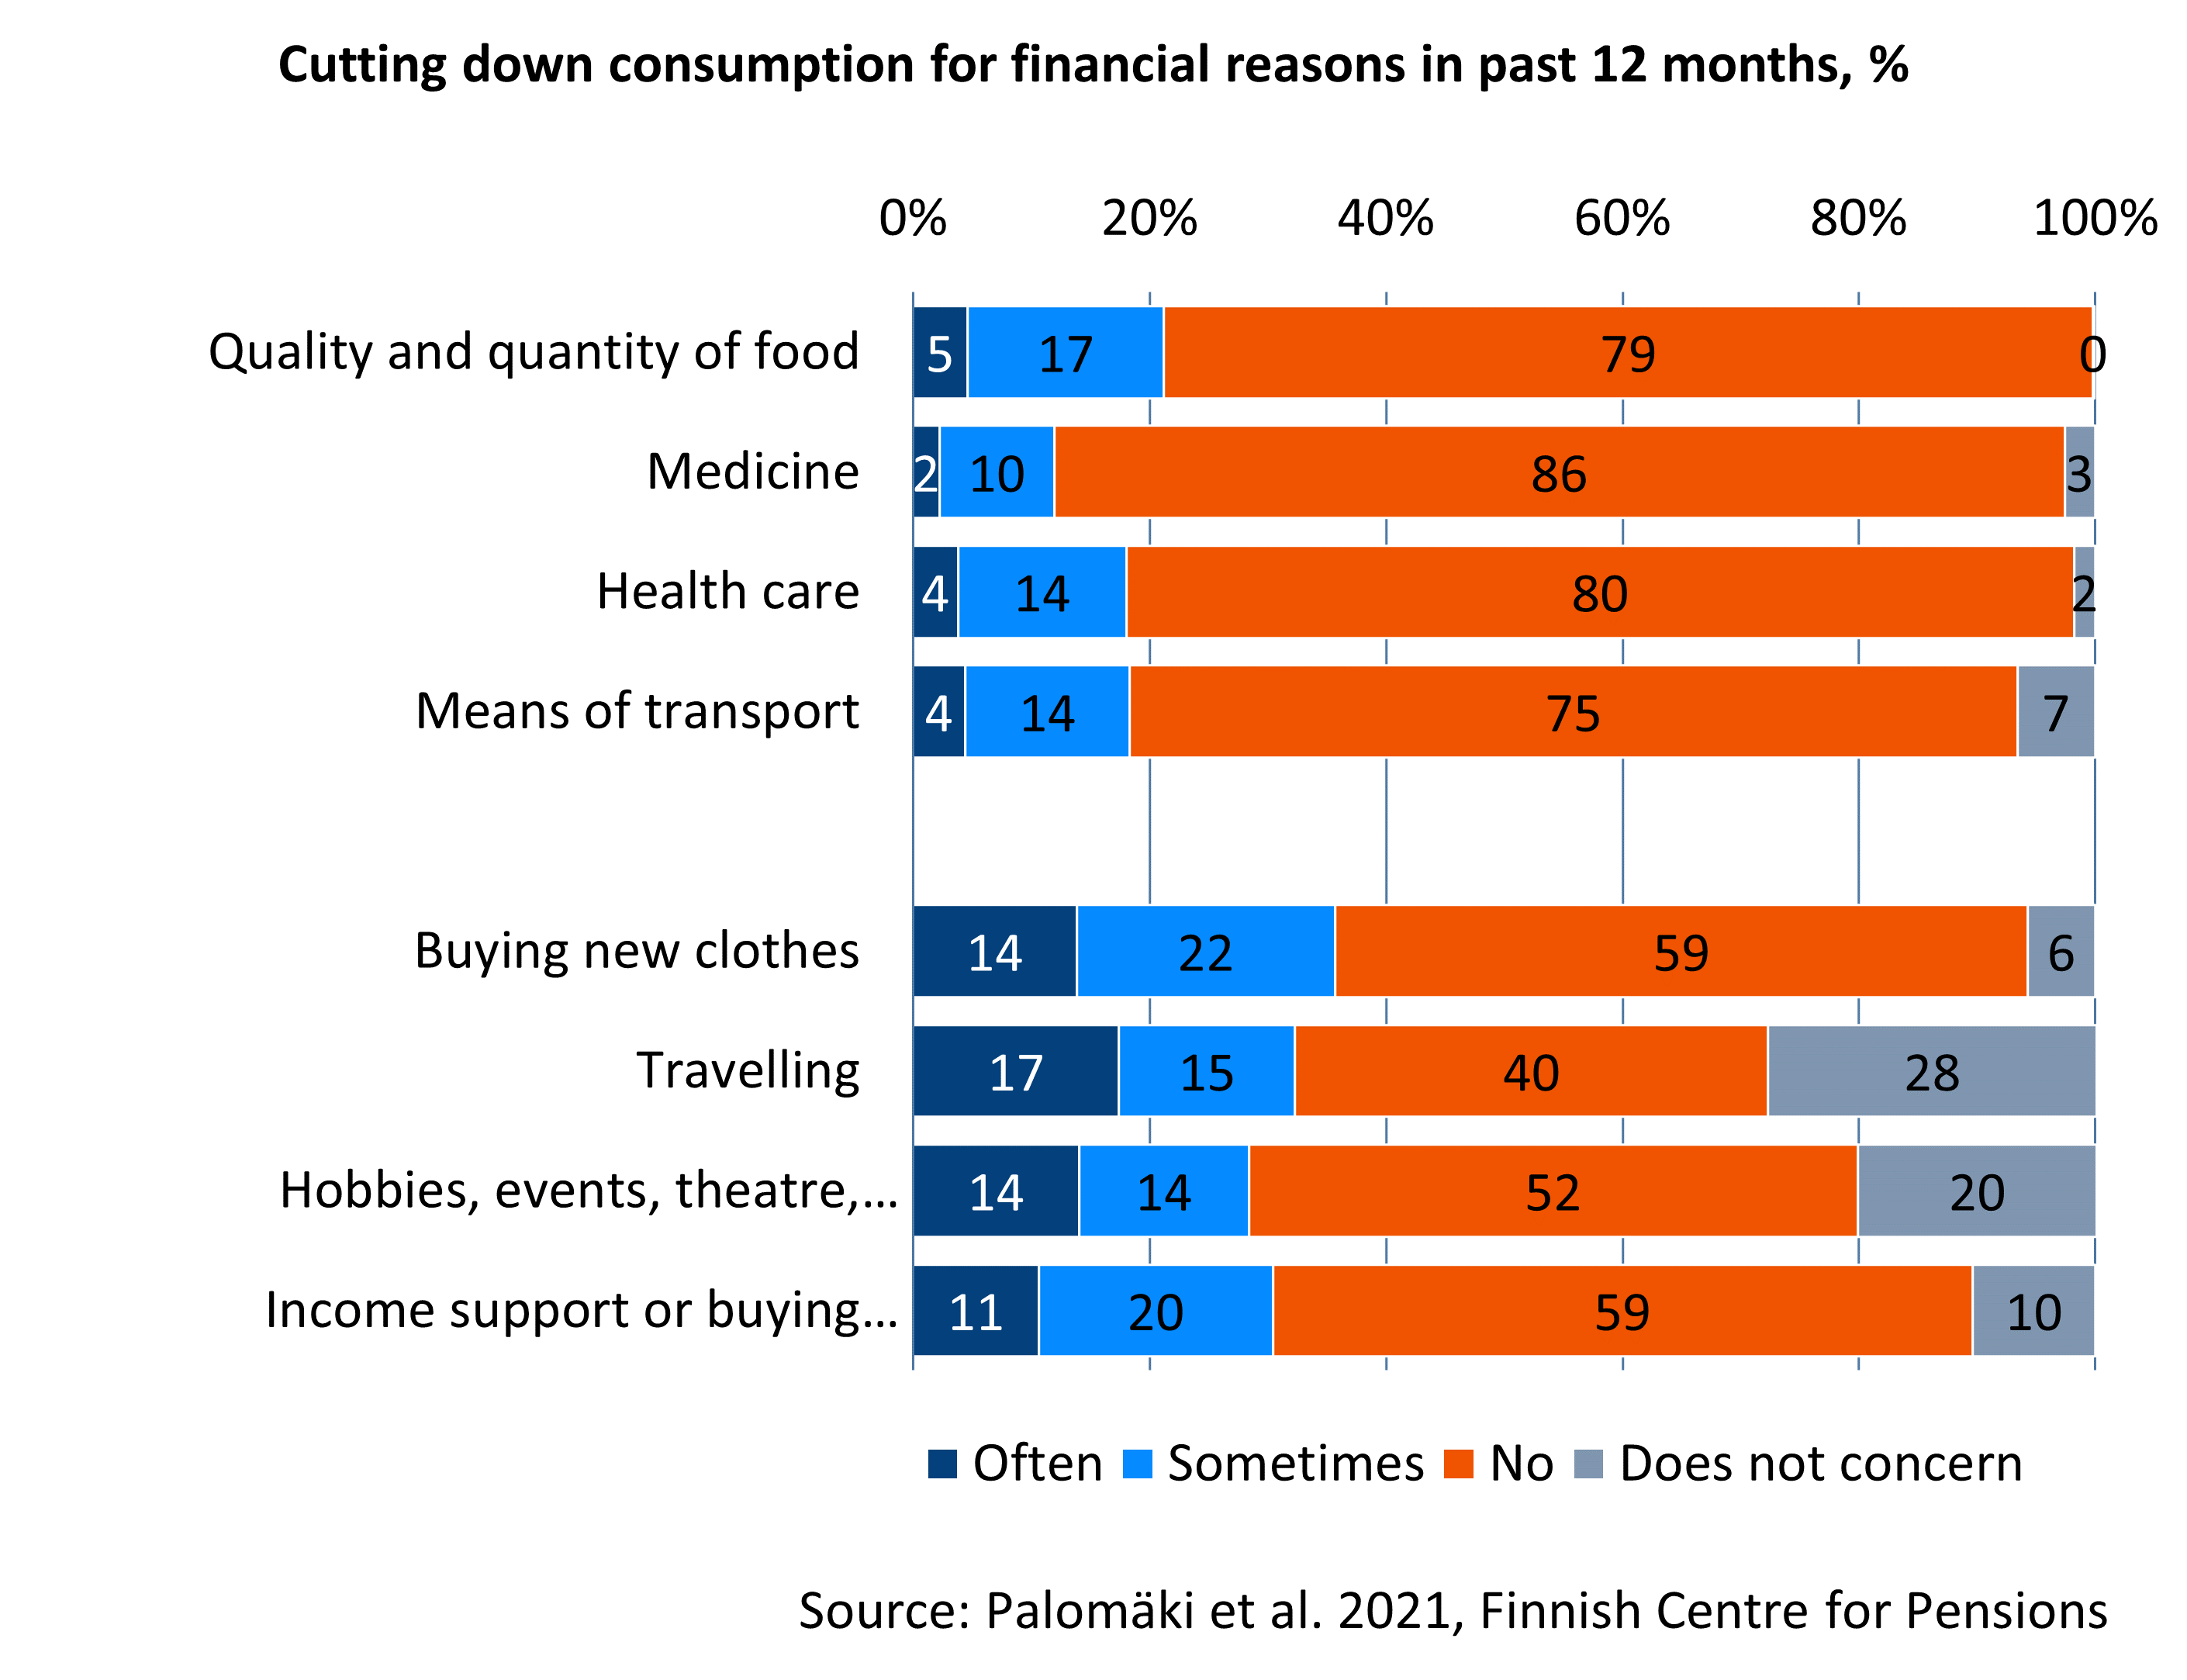
Most pensioners did not have to cut down consumption for financial reasons in 2020. If they did, they primarily cut down on leisure-time consumption and buying new clothes. Some were also forced to cut down on necessities such as food or medication.
Typically, the income perceptions are permanent. Of old-age pensioners, around 60 per cent found it somewhat easy to make ends meet both in 2017 and 2020. This perception is most common among those in a better financial situation. Nearly 25 per cent experienced smaller or larger difficulties in both years, but for 15 per cent, making ends meet became easier. These groups were dominated by those with a lower-than-average economic status.
Publications:
There is no single definition for poverty or way to measure it, and there is no official poverty threshold in Finland. Often, poverty is examined based on income. Other ways to measure poverty is severe material deprivation or receiving income support. Different methods provide a slightly different picture of how common poverty in retirement is.
Pensioners are at risk of poverty as often as Finns on average
In 2023, around 13.6 per cent of pensioners were at risk of poverty when it was examined in the most common way. A person is viewed to be at risk of poverty when the disposable income of the household is less than 60 per cent of the population’s median income.
The temporal variation in the at-risk-of-poverty rate among pensioners is also greater than among the total population. For pensioners, the income is more often closer to the 60-per-cent poverty threshold than it is for the total population. Changes in the poverty threshold thus affect the number of pensioners at risk of poverty more than average.
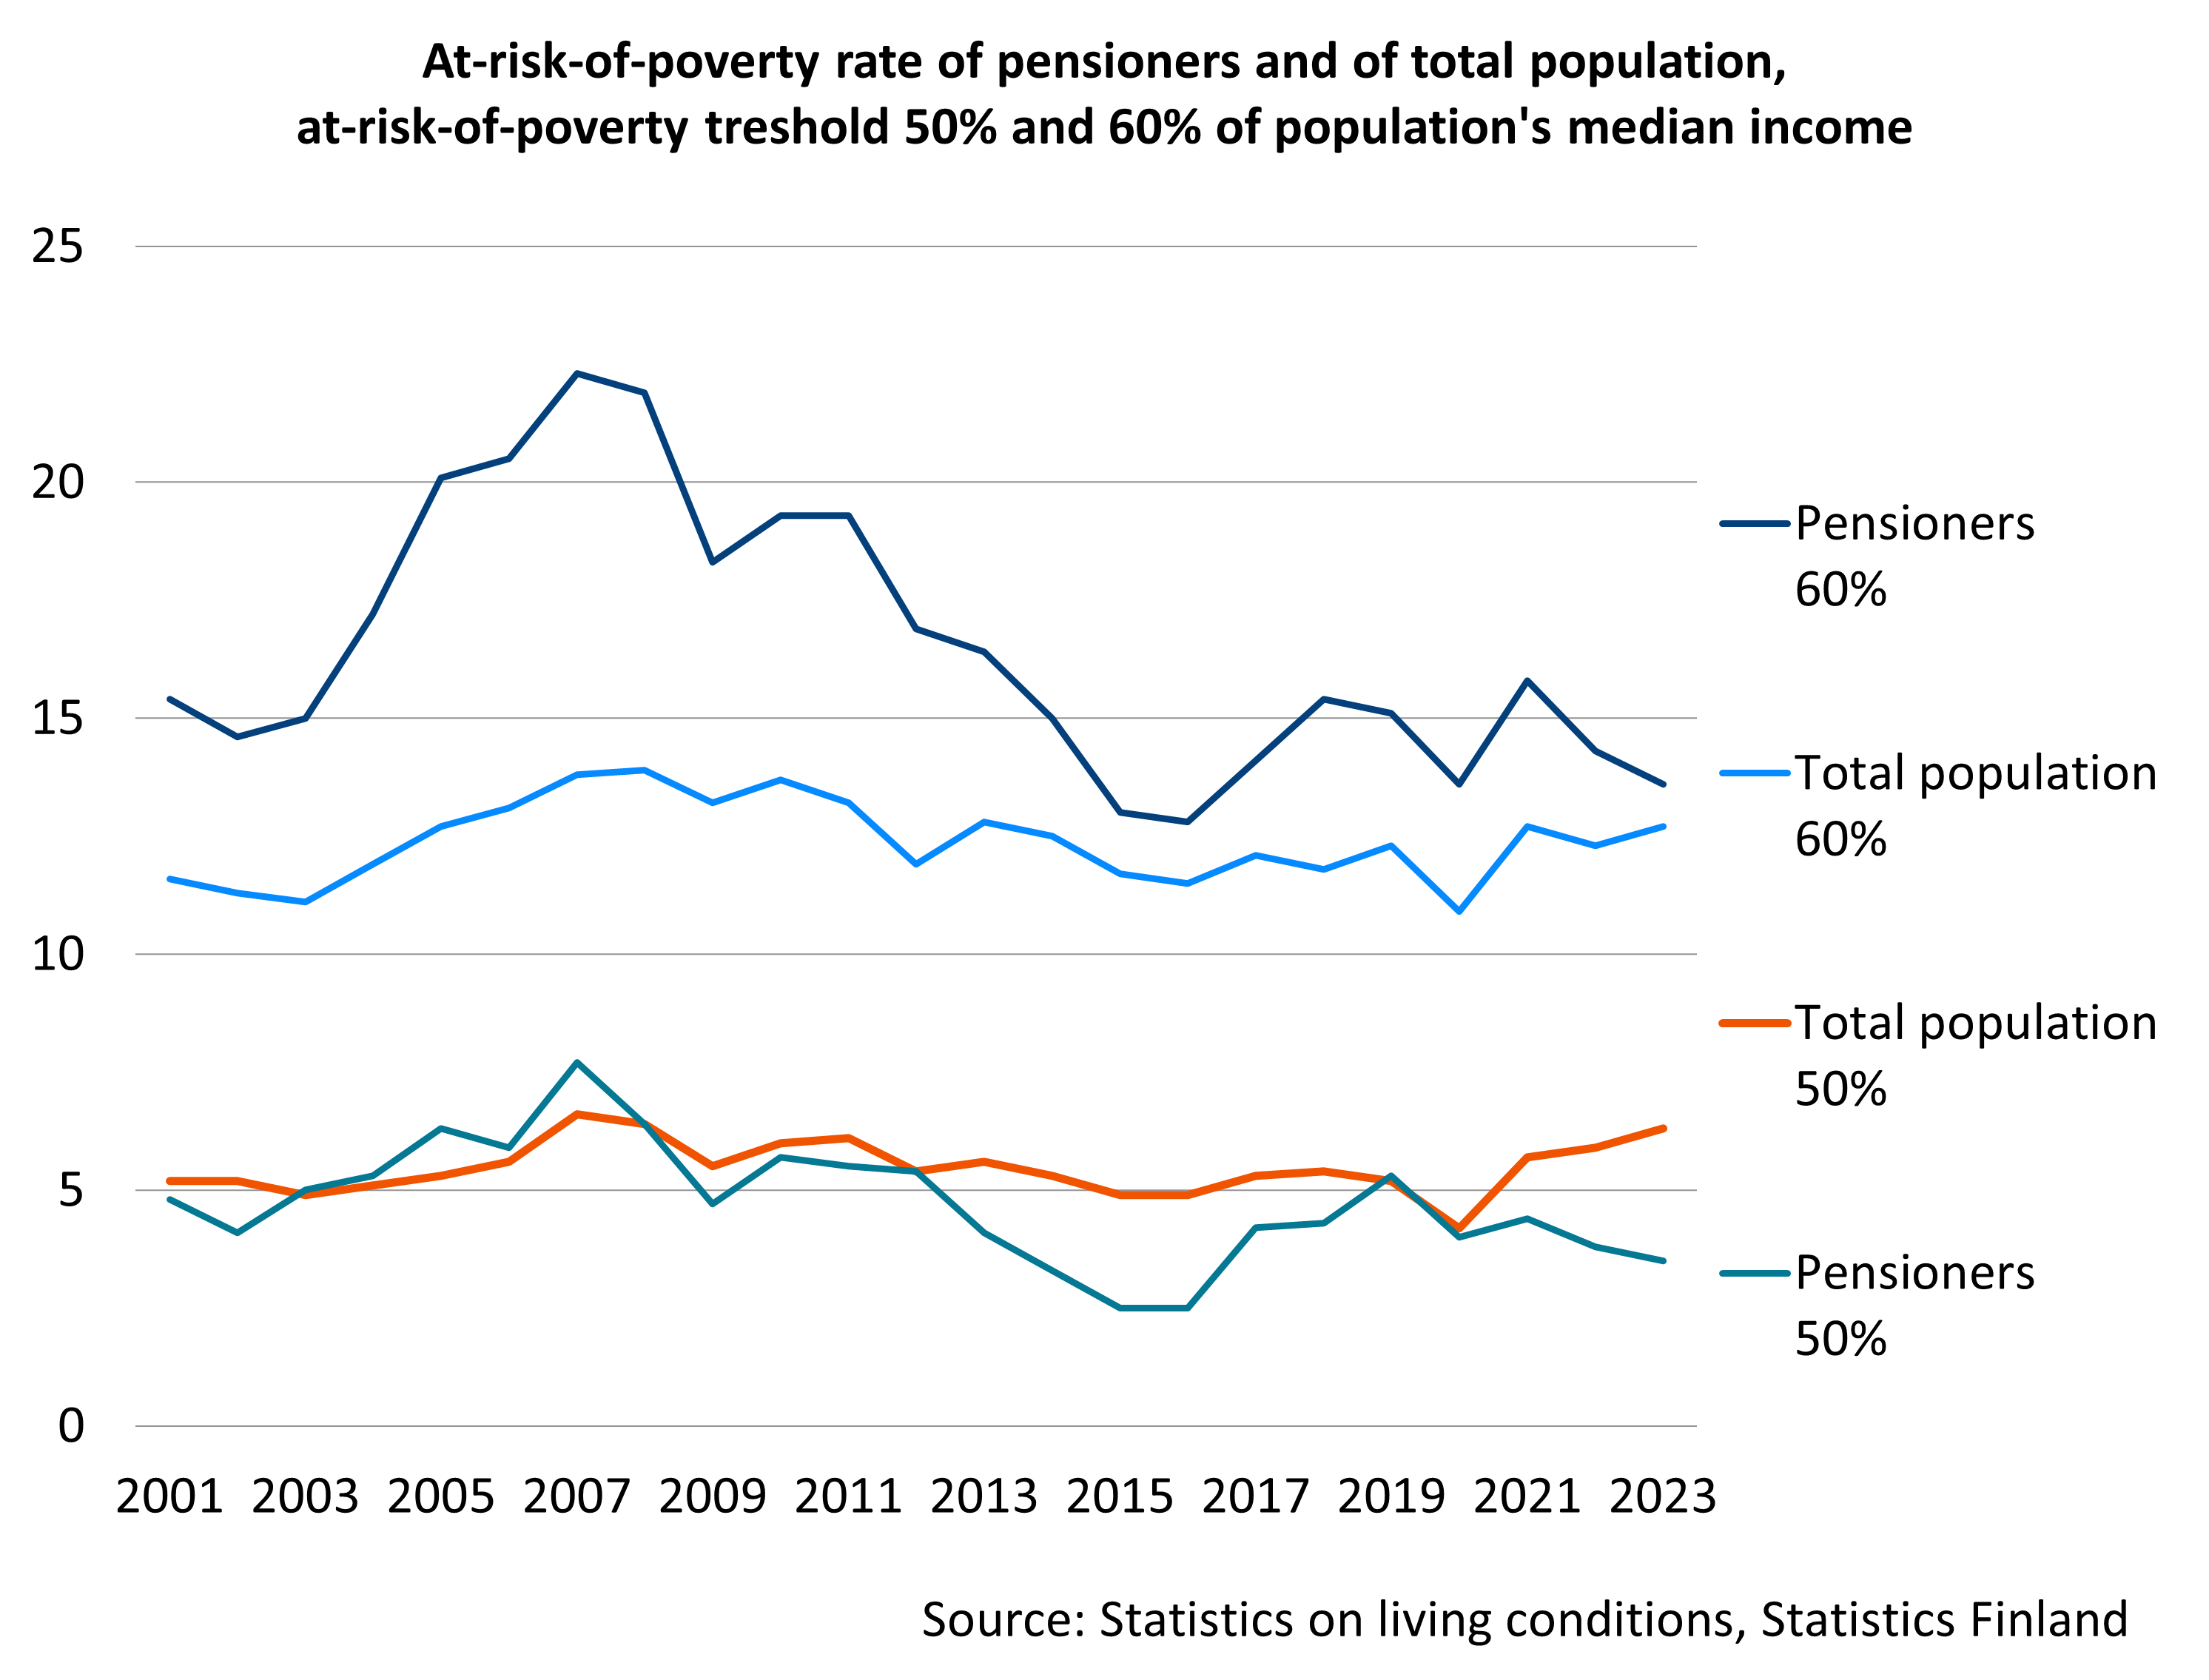
At the 50-per-cent threshold, pensioners are much less likely to be at risk of poverty, and the temporal variation is much smaller than at the higher threshold. The at-risk-of-poverty rate for pensioners is also closer to the at-risk-of-poverty rate for the total population.
Publications:
- Ilmakunnas 2022. The magnitude and direction of changes in age-specific at-risk-of-poverty rates: an analysis of patterns of poverty trends in Europe in the mid-2010s (Cambridge)
- Kuivalainen et al. 2022. Pensions and pensioners’ economic wellbeing – Development from 1995 to 2020 (Julkari, summary in English)
The youngest and oldest pensioners and those living alone more likely at risk of poverty
Pensioners are not a homogenous group in terms of income. Poverty is more common among the youngest and the oldest pensioners and pensioners living alone.
The at-risk-of-poverty rate of younger pensioners (effectively those on a disability pension) has tripled in two decades. By contrast, the at-risk-of-poverty rate of the oldest pensioners has decreased over the last decade.
Family size also affects risk of poverty. Pensioners who live alone are considerably more often at risk of poverty than those with a family. The youngest and oldest pensioners who live alone are at the highest risk of poverty.
Risk of poverty among women aged over 75 is more common than among men, partly because there are many women over 75-years-of-age who live alone. Nevertheless, the gender gap has narrowed over the past 20 years as the risk of poverty among men living alone has increased.
Pensioners’ risk of poverty often inherited from time before retirement
The risk of poverty increases slightly, but not significantly, during the first ten years of retirement. Income changes relatively little during retirement. Many pensioners at risk of poverty are living on a meagre income already before retirement.
Long-term risk of poverty (two out of three years of risk of poverty) is more common among people aged over 75 years. In particular older women risk poverty for a long time.
Publications:
- Ahonen & Kuivalainen 2024 .Gender differences in old-age poverty in 14 EU countries: exploring the role of household structure (Springer)
- Kuivalainen et al. 2022. Pensions and pensioners’ economic wellbeing – Development from 1995 to 2020 (Julkari, summary in English)
- Rantala 2020. Studies on the dynamics of low income and economic well-being of pensioners in Finland in 1995–2014 (Julkari, summary in English)
- Rantala et al. 2017. The economic welfare of disability pensioners’ in the 2000s (Julkari, summary in English)
- Rantala et al. 2019. Samankaltaistuuko ikäihmisten köyhyys? Näkökulmia 75–84-vuotiaiden naisten ja miesten pienituloisuuteen (Is the poverty gender gap shrinking? Perspectives on poverty rates among older men and women aged 75–84) (Julkari)
Pensioners less likely to have serious income problems
Receiving income support, suffering material deprivation and needing food aid often signal serious income problems. They are also considered one form of poverty.
Among pensioners, the share of persons receiving income support is clearly less than among the rest of the population. In 2022, around 1.7 per cent of the population aged 65 or over had received income support. The equivalent figure for the total population was 7.2 per cent. Persons who have reached their retirement age typically receive income support for health care and medical expenses.
Of customers receiving food aid, around one third are pension recipients. Pensioners who have used food aid had received it for a longer period than others, but they experienced problems with making a living less often than others. Pensioners seeking food aid lived alone and were more often than others in poor health. In population surveys, a few per cent of pensioners have stated that they have had to resort to food aid.
For pensioners, material deprivation is lesser than for working-aged people. In other words, they less often lack (against their will) commodities that are considered necessities. Serious material and social deprivation, as reviewed by the European Union, is rare in Finland: of retirees who have turned 65, around 1.2 per cent experienced serious material deprivation in Finland in 2023. The equivalent share of 18–64-year-olds was 3.7 per cent.
Publications:
- Ilmakunnas & Mäkinen 2020. Age differences in material deprivation in Finland: How do consensus and prevalence-based weighting approaches change the picture? (Springer)
- Kuivalainen & Ylikännö 2020. Perustoimeentulotukea saavat vanhuseläkeläiset (pensioners on an old-age pension who receive basic income support) Ojasta allikkoon? (out of the frying pan and into the fire?) Toimeentulotukiuudistuksen ensi metrit (first steps of the income support reform) (Helda)
- Laihiala 2019. Eläkeläiset hyväntekeväisyysruoka-avun asiakkaina (pensioners seeking charity food-aid) (Julkari)
- Palomäki et al. 2021. Pensioners’ perceived economic welfare in 2020 compared to in 2017 (Julkari, summary in English)
An international evaluation of the Finnish pension system finds that the system efficiently averts poverty and provides a reasonable income for pensioners. Income inequality of pensioners is smaller than average in Finland.
Read more on Etk.fi:
Publications:
- Andersen 2021. Pension adequacy and sustainability – An evaluation of the Finnish pension system Finnish Centre for Pensions 2021 (Julkari, summary in English)
- EU 2021. 2021 pension adequacy report (EU)
- Kuivalainen et al. 2022. Pensions and pensioners’ economic wellbeing – Development from 1995 to 2020 (Julkari, summary in English)
- OECD 2023. How does Finland compare? (OECD)
- OECD 2023. Pensions at a Glance 2019: OECD and G20 Indicators (OECD)
Income difficulties experienced less often in Finland than in other European countries
Compared to other European countries, Finnish pensioners clearly less often experience income difficulties. The differences between other countries are visible in, for example, how often pensioners have been forced to refrain from doing things they want due to lack of money. In Finland, as in many other European countries, people of pensionable age (aged 65+) are less likely to experience income difficulties than younger people, even when accounting for differences in income levels across different age groups.
However, in Finland pensioners have struggled financially previously in their life more often than in other European countries on average. The duration of the periods of income difficulties have been slightly shorter than in other European countries.
Other pensioners form the reference group in income comparisons of pensioners. Pensioners experience more problems with making ends meet in those European countries in which the average income of pensioners is higher. The income level or income inequality of the total population make no difference.
As a rule, retirement weakens the income perception of those in European countries who retire from work compared to those who retire from unemployment. The perception of income among pensioners depends not only on the size of income but also on whether the income stems from pensions, earnings, wealth or other social benefits.
Publications:
- Ilmakunnas et al. 2024. Association between age and subjective economic hardship across the income distribution in Europe (Julkari)
- Kuitto et al. 2021. The financial situation across the life-course (Väestöliitto)
- Palomäki 2018. Does It Matter How You Retire? Old-Age Retirement Routes and Subjective Economic Well-Being (Julkari)
- Palomäki 2018. Pensioners’ subjective economic well-being in European countries: comparisons behind the income satisfaction paradox (Julkari)
- Palomäki et al. 2022. Size or Content of the Pie? Source of Income and Perceived Income Adequacy of Older Europeans (Tandfonline)
- Palomäki et al. 2024. What it means to be poor: dimensions of economic hardship among older people living in poverty across Europe (julkari.fi)
- Riekhoff et al. 2024. A long arm of adversity? Financial hardship during the life course and income in retirement (OSF Preprints)
The Finnish Centre for Pensions conducts research on pensioners’ income and its development about every five years. The latest study was published in 2022.
- Pensions and pensioners’ economic wellbeing – Development from 1995 to 2020 (Julkari, summary in English)
- Pensions and Pensioners’ economic welfare 1995–2015 (Julkari, Summary in English)
- Pensions and Pensioner Income 2000–2010 (Julkari, Executive Summary in English)
- Pensions and Pensioner Income 1990–2005 (Executive summary in English, Julkari)
- Eläkeläisten toimeentulo 1990-luvulla (pensioner income in the 1990s), (Julkari)
FAQs
If the national and earnings-related pension of a pension recipient is below the pension income limit defined by law, the difference is supplemented with the guarantee pension. The aim of the guarantee pension that came into effect in 2011 is to secure a minimum pension for pension recipients. In 2025, the maximum monthly guarantee pension is 986.30 euros.
At the end of 2021, a total of 116,369 persons received a guarantee pension in Finland. More than half (57%) of them are under the age of 65.
In 2024, the median monthly pension was 1,848 euros. One in three of all pension recipients received a monthly pension of less than 1,250 euros.
Publications:
The top decile of the population is often defined as the high-income population. In recent years the high-income threshold has increasingly been set at the top one percent or one permille. High income is also defined in relation to the average income of the population. Typical thresholds for high income have been an income that is twice or thrice the median income.
There is no general definition for a high pension, either. In 2015, the threshold for the highest pension income decile was 2,638 euros per month. Slightly under 143,000 pensioners had a gross pension that was higher than 2,638 euros per month. Among the pensioners, one in one hundred had a monthly pension that was higher than 4,970 euros, and one in one thousand had a monthly pension that was higher than 8,585 euros.
The threshold for the upper decile of pension income is 1.9 times the median pension, while the highest per cent is 3.6 times and the highest permille 6.6 times the median pension. The relative difference between the high pensions and the median pensions has remained equally high from 1995 to 2015.
In 2015, slightly less than nine per cent of all pensioners had a pension that was at least twice as high as the median pension. The share has remained almost the same since 1995. Correspondingly, two per cent of all pensioners had a pension that was at least three times as high as the median pension. This has also remained unchanged since the mid-1990s.
Publications:
In 2023, around 13.6 per cent (or 194,000) of Finnish pensioners were at risk of poverty (had a disposable income of less than 60 per cent of the median income of the total population).
There is no official definition of poverty in Finland. Often, poverty or the risk of poverty is reviewed in terms of income. According to the most general definition, a person is at risk of poverty if their disposable income is less than 60 per cent of the median income of the Finnish population. Statistics Finland calls persons who face the risk of poverty for low-income earners. Each year, Statistics Finland publishes statistics on low-income earners based on its income distribution statistics.
The poverty threshold can also be set at, for example, 50 per cent of the population’s median income. Instead of defining income as the disposable income, it can be defined as the disposable income including imputed income items. The number of low-income pensioners varies depending on the at-risk-of-poverty threshold and the definition of income.
| At-risk-of-poverty threshold and concept of income | Share of pensioners, % | Number of pensioners at risk of poverty |
|---|---|---|
| 50% of population’s disposable income | 3.5 | 50,000 |
| 50% of population’s disposable income incl. imputed income items | 3.5 | 49,000 |
| 60% of population’s disposable income | 13.6 | 194,000 |
| 60% of population’s disposable income incl. imputed income items | 12.7 | 182,000 |
Poverty can also be reviewed in terms of, for example, drawing income support or suffering from severe material deprivation. Less than two per cent of the population aged 65 or over either received income support or suffered from severe material and social deprivation.
More on other sites:
Two different concepts are used in assessing the income of households: the disposable income per consumption unit or the disposable income including imputed income items per consumption unit.
The disposable income includes the net combined income of all members of the household, such as pensions and other income transfers, capital income and earnings and income from self-employment. The amount is deducted with taxes and other fees. To make households of different sizes and of different ages comparable, the income is divided by consumption unit. This is the main definition of income used by Statistics Finland and Eurostat in their statistics on income distribution.
The other, often used definition of income – the disposable income including imputed income items– is a slightly wider concept than the disposable income. This income concept includes not only the monetary income but also imputed income items of which imputed rent is the most significant. It depicts the financial benefit that the household receives compared to a household that lives in rental housing.
The imputed rent can be significant particularly for pensioners since many of them live in debt-free owner-occupied housing. The disposable income including imputed income items thus improves the income position of pensioners relative to the rest of the population.