International comparison of pension funds’ investment performance: Another strong year for Finnish investors
Finnish pension investors performed well in the international investment performance comparison for 2025. In the category of investors governed by solvency regulations, the Finns once again took all the top positions, just as they did the previous year.
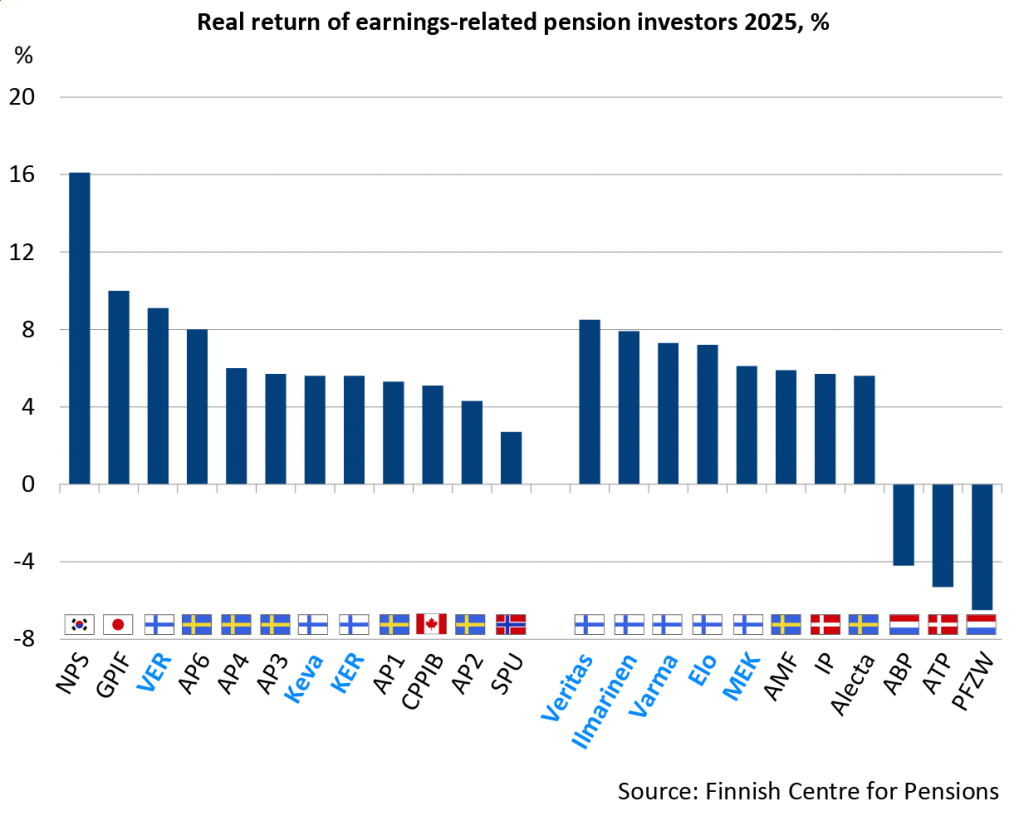
The top-performing Finnish pension investor was Veritas, which achieved a real return of over 8 per cent in the investment performance comparison conducted by the Finnish Centre for Pensions. Ilmarinen’s real return was just under 8 per cent, while both Varma and Elo recorded real returns exceeding 7 per cent.
Among those outside the scope of solvency regulation, Finnish pension investors also performed strongly. The State Pension Fund (VER) delivered a return of more than 9 per cent, and Keva’s return approached 6 per cent.
Data in Graph “Real return of earnings-related pension investors” as an accessible Excel file.
“The robust rise of the Helsinki Stock Exchange, combined with inflation remaining close to zero, significantly supported the real returns of domestic pension investors”, evaluates Special Adviser Antti Mielonen from the Finnish Centre for Pensions.
Finnish investors comfortably surpassed the average. The combined real return for all pension investors included in the comparison last year was 5.2 per cent.
The AI boom propelled the Koreans to victory
The year 2025 highlighted the considerable annual fluctuations in pension fund returns across different countries and investors.
Despite its reputation for strong performance, the Norwegian pension fund SPU achieved a real return of just under 3 per cent last year.
“SPU’s equity investments, with a strong emphasis on the United States stock market, generated positive returns. However, this time, the weakening of the dollar reduced those gains”, explains Liaison Manager Mika Vidlund from the Finnish Centre for Pensions.
Last year’s top-performing pension investor was the South Korean public sector pension fund NPS, which achieved an impressive real return of 16 per cent.
“The Korean stock market soared last year,” Vidlund continued. “For example, Samsung’s share price more than doubled, driven by the artificial intelligence boom and strong demand for memory chips.”
Fixed income investments weighed down Danish ATP and Dutch PFZW
The weakest investment return last year was recorded by the Dutch healthcare and welfare pension fund PFZW, whose real return plummeted to 6.5 per cent in the negative.
Danish ATP also saw its real return fall into the negative.
“Both PFZW and ATP suffered from the rise in long-term interest rates. These pension investors share a strong emphasis on bonds in their portfolios. When long-term interest rates increase, the value of bonds declines”, Mielonen states.
ATP’s high-risk investment portfolio delivered strong returns, with a nominal increase of nearly 20 per cent. Nevertheless, the overall return, as determined by the Danish Financial Supervisory Authority, remained negative for ATP.
“A significant portion of ATP’s assets is tied up in interest rate hedges for its pension liabilities. The rise in interest rates diminished the value of this hedging portfolio, which in turn pushed the overall investment return for the pension fund into the negative”, Mielonen specifies.
Best long-term real return was 8 per cent
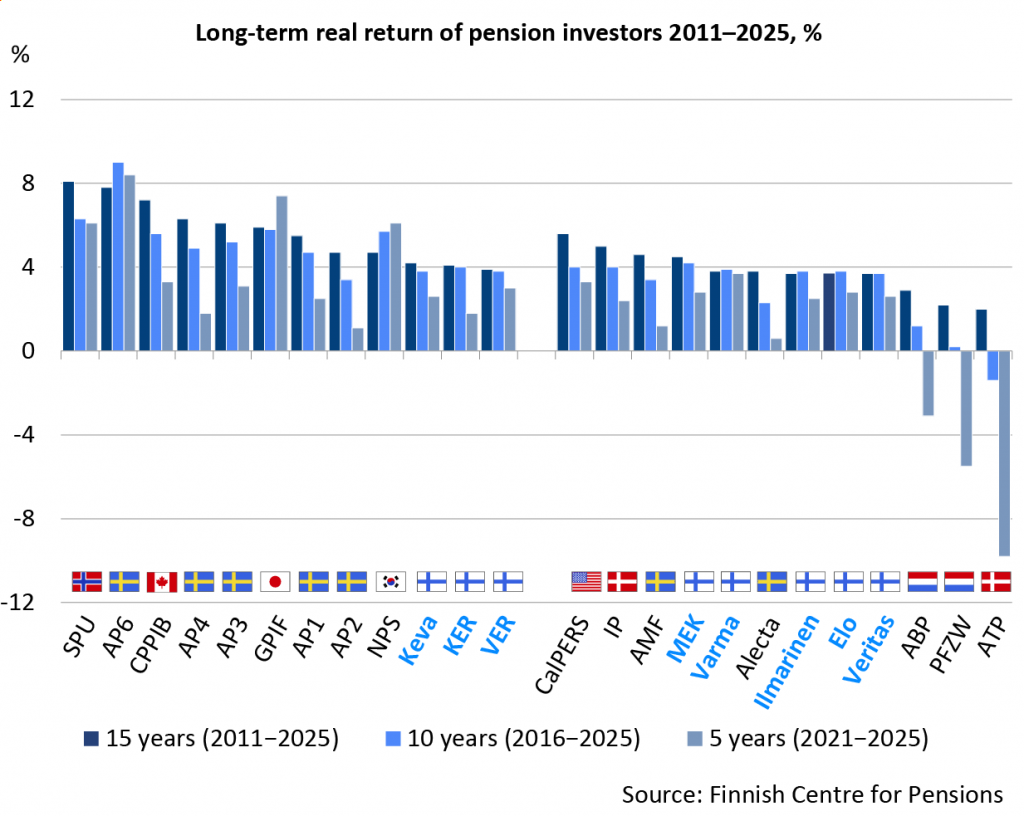
Examining performance over an extended period helps smooth out annual fluctuations in investment returns. According to the Finnish Centre for Pensions’ comparison, the average real return for pension investors (after costs) has been around 4 per cent over the past 10 years (2016–2025). When looking over 15 years (2011–2025), the average real return is nearly 5 per cent.
The Norwegian fund SPU stands out with the highest long-term real return, reaching an impressive 8.1 per cent.
The best long-term real returns among Finnish investors have been achieved by the Seafarers’ Pension Fund (MEK), Keva and the Church Pension Fund (KER). Over the past 15 years, MEK has an average real return of 4.5 per cent per year, Keva of 4.2 per cent and KER of 4.1 per cent.
The weakest performer has been Denmark’s ATP, with a 15-year real return of 2 per cent.
Data in Graph “Long-term real return of pension investors 2011–2025″ as an accessible Excel file.
Keva holds the largest equity allocation among Finnish investors
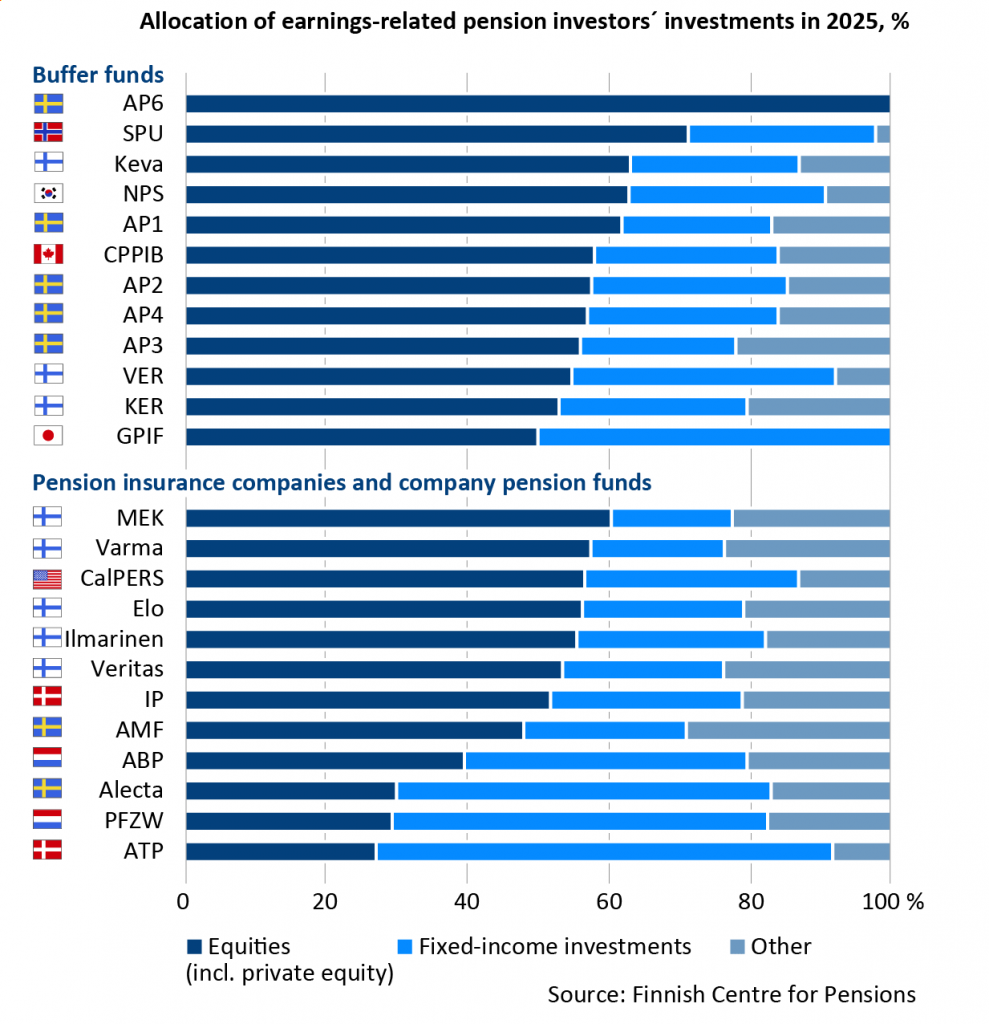
At the turn of the year, just over half of Finnish pension investments were held in equities. Of the domestic investors, Keva had the highest proportion allocated to shares, at roughly 63 per cent.
The strongest equity weighting in the investment return comparison was found in Norway’s SPU. More than 71 per cent of its assets were invested in equities.
As in last year’s comparison, most Finnish pension investors had roughly one fifth of their portfolios allocated to fixed income securities. The State Pension Fund (VER) had the greatest weighting in bonds, with these instruments making up more than one third of the fund’s allocation.
The highest proportion of fixed income investments in the comparison was found at Denmark’s ATP, which had placed almost two thirds of its assets in fixed income securities.
Investment returns are also affected by costs
Expenses have a significant impact on investment returns over the long term. For the first time, the Finnish Centre for Pensions is publishing a separate comparison of costs, examining pension investors’ expenses in Sweden, Norway, Canada, the Netherlands and Denmark during the years 2020 to 2024.
“Our aim was to find out how transparently and accurately pension institutions in different countries report their investment costs,” explains Vidlund.
According to Vidlund, the results of the cost comparison are indicative. A higher level of expenses does not necessarily mean lower efficiency. It may also be due to the pension investor’s investment strategy, which aims for a better risk-return ratio.
“Costs are determined primarily by investment allocation, the level of activity or passivity in investment operations, and the extent to which assets are managed internally or via external asset managers. Reporting practices also differ between countries. That is why expenses are not entirely comparable”, Vidlund notes.
The highest investment costs are incurred by Canada’s CPPIB, whose portfolio focuses on equities and other higher-risk investments. In 2024, CPPIB’s average costs were 0.90 per cent of committed capital.
Norway’s oil fund, SPU, has the lowest investment costs, averaging 0.04 per cent of committed capital. This fund largely tracks equity indexes.
Danish ATP incurs average costs of 0.29 per cent, while Dutch PFZW sees average expenses of 0.36 per cent of committed capital in 2024.
The combined investment costs of Sweden’s AP funds average 0.22 per cent of committed capital. According to the Swedish government, the proportion of capital managed internally by the AP institutions is internationally high, which may contribute to enhanced cost efficiency.
The most recent data on costs for Finnish pension investors is from 2024. According to the Financial Supervisory Authority’s estimate, the expenses for earnings-related pension insurers’ investment activities were 1.0 per cent of committed capital.
Antti Mielonen, on the other hand, points out that expenses should primarily be compared between pension institutions rather than between countries.
“For instance, in the Netherlands there are hundreds of pension funds. Their costs range from 0.1 per cent to 0.8 per cent. Dutch pension investors’ cost reporting is also more detailed than elsewhere. In recent years, the Netherlands has systematically invested in improving cost transparency and can be regarded as an international pioneer in cost reporting.”
Comparison of returns among 24 pension investors
The Finnish Centre for Pensions’ investment return comparison includes 24 pension investors from across the globe. These investors are categorised into two groups based on their risk-taking capacity.
Investor-specific investment rules (buffer funds):
- Sweden: AP1-AP6 buffer funds
- Canada: Canada Pension Plan Investment Board (CPPIB)
- Norway: Norwegian Government Pension Fund Global (SPU)
- Japan: Government Pension Investment Fund (GPIF)
- South Korea: National Pension Service (NPS)
- Finland: Keva, State Pension Fund (VER), Church Pension Fund (KER)
Subject to solvency regulations:
- USA: Californian Public Employees’ Retirement System (CalPERS)
- Netherlands: public-sector pension fund (ABP) and healthcare and welfare pension fund (PFZW)
- Sweden: Alecta and AMF Pension
- Denmark: ATP and Industriens Pension (IP)
- Finland: Earnings-related pension insurance companies (Elo, Ilmarinen, Varma, Veritas) and the Seafarers’ Pensions Fund (MEK).
Cost comparison of 12 pension investors
In its comparison of investment costs, the Finnish Centre for Pensions examines twelve investors from the years 2020 to 2024. The analysis delves not only into the expenses relate to investment activities but also explores differences in cost structures and the comparability of reporting practices.
Costs are assessed in relation to committed capital. Committed capital refers to the average amount of assets available for investment throughout the year.
Read more
- Investment return on pension assets (Etk.fi)
- Investments of the earnings-related pension system (Etk.fi)
Edited on 24 April 2026 at 9:38: The percentage figure has been corrected from 5.3 to 5.2%: “The combined real return for all pension investors included in the comparison last year was 5.2 per cent.”