Pensioners’ economic wellbeing
The economic wellbeing of pensioners in Finland has improved over the decades. The vast majority is not currently experiencing any significant problems with their livelihood. However, despite the favourable development, some pensioners still find it very difficult to make ends meet.
Pensions are to maintain a decent income in retirement and prevent poverty. Statutory pensions are the most important source of income for pensioners.
Income is the primary indicator of financial well-being. For pensioners, most of their income comes from pensions, though some also receive earnings from employment, income from assets, or transfers such as housing benefits for pensioners.
The average monthly total pension of pensioners living in Finland at year-end 2025 was 2,138 euros. The average total pension has increased in the 2000s by more than one third.
The main part of the increase in total pension is due to changes in pension recipients. The main part of new pension recipients in the 2000s have been able to accrue pension throughout their working life. Their working lives have also spanned a longer period, and their income have been higher than those of older pension recipients.
Read more on Etk.fi:
Publications:
- Kuivalainen et al. 2022. Pensions and pensioners’ economic wellbeing – Development from 1995 to 2020 (Julkari, summary in English)
- Pension indicators 2025: Current state and future outlook for earnings-related pension in Finland
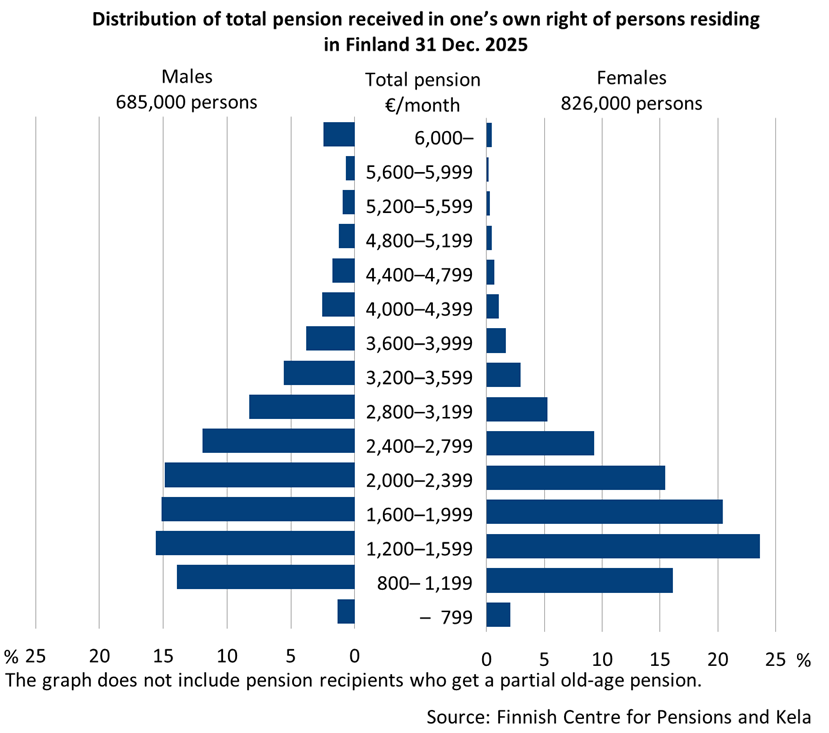
Women’s monthly pension is one fifth smaller than men’s
Men’s average total monthly pension in 2025 was 2,388 euros and women’s 1,930. The gender gap has narrowed in the last decades, but the development has been slow, and women’s average monthly pensions continue to be around one fifth lower than men’s.
The difference in men’s and women’s earnings also affects the gender gap in pensions. There is no large gender gap in the average employment rates, length of working life or retirement today, but the difference in wages is considerable also internationally. The uneven distribution of family leaves, particularly long periods of home care allowance, and informal care responsibilities contribute to widening the earnings and pension gap between men and women.
Publications:
- Kuitto & Kuivalainen 2021. Gender inequalities in family leaves, employment and pensions in Finland (Julkari)
- Kuivalainen et al. 2019. Pension differences between women and men – Overview of research and statistics. (Description sheet in English; Valto)
- Rantala et al. 2019. Samankaltaistuuko ikäihmisten köyhyys? Näkökulmia 75–84-vuotiaiden naisten ja miesten pienituloisuuteen (is the poverty gender gap shrinking – perspectives on poverty rates among older men and women aged 75–84)
- Rantala & Riihelä 2016. Income differences between retired women and men in 1995-2013 (Summary in English; Julkari)
- Ritola 2020. Pensions and Gender Equality: Gap in Men’s and Women’s Pensions through Example Cases from Five Cohorts (Summary in English; Julkari)
- Sten-Gahmberg et al. 2024. Employment, earnings, and pension accumulation of working-age informal carers: A register-based study of contracted information carers 2005–2023 (Summary in English; Julkari)
Average total pension of disability pension recipients around one third less than of old-age pension recipients
Earnings-related pensions are based on earnings from work. Disability pension recipients have a shorter working life than others. Earnings-related pensions for those who retire early due to disability are often below average, as recipients have had less time to accrue pension contributions and the earnings used to calculate their projected pension are typically lower.
The average disability pension level has decreased in the 2000s because disability pension recipients are younger than before and they spend a longer time in retirement. For this reason, the national pension has become increasingly important as a source of income for recipients of disability pensions.
Among recipients of disability pensions, individuals receiving partial disability pensions are typically in the strongest financial position because most of them also earn income from work. In contrast, those receiving only a national pension are the least well-off.
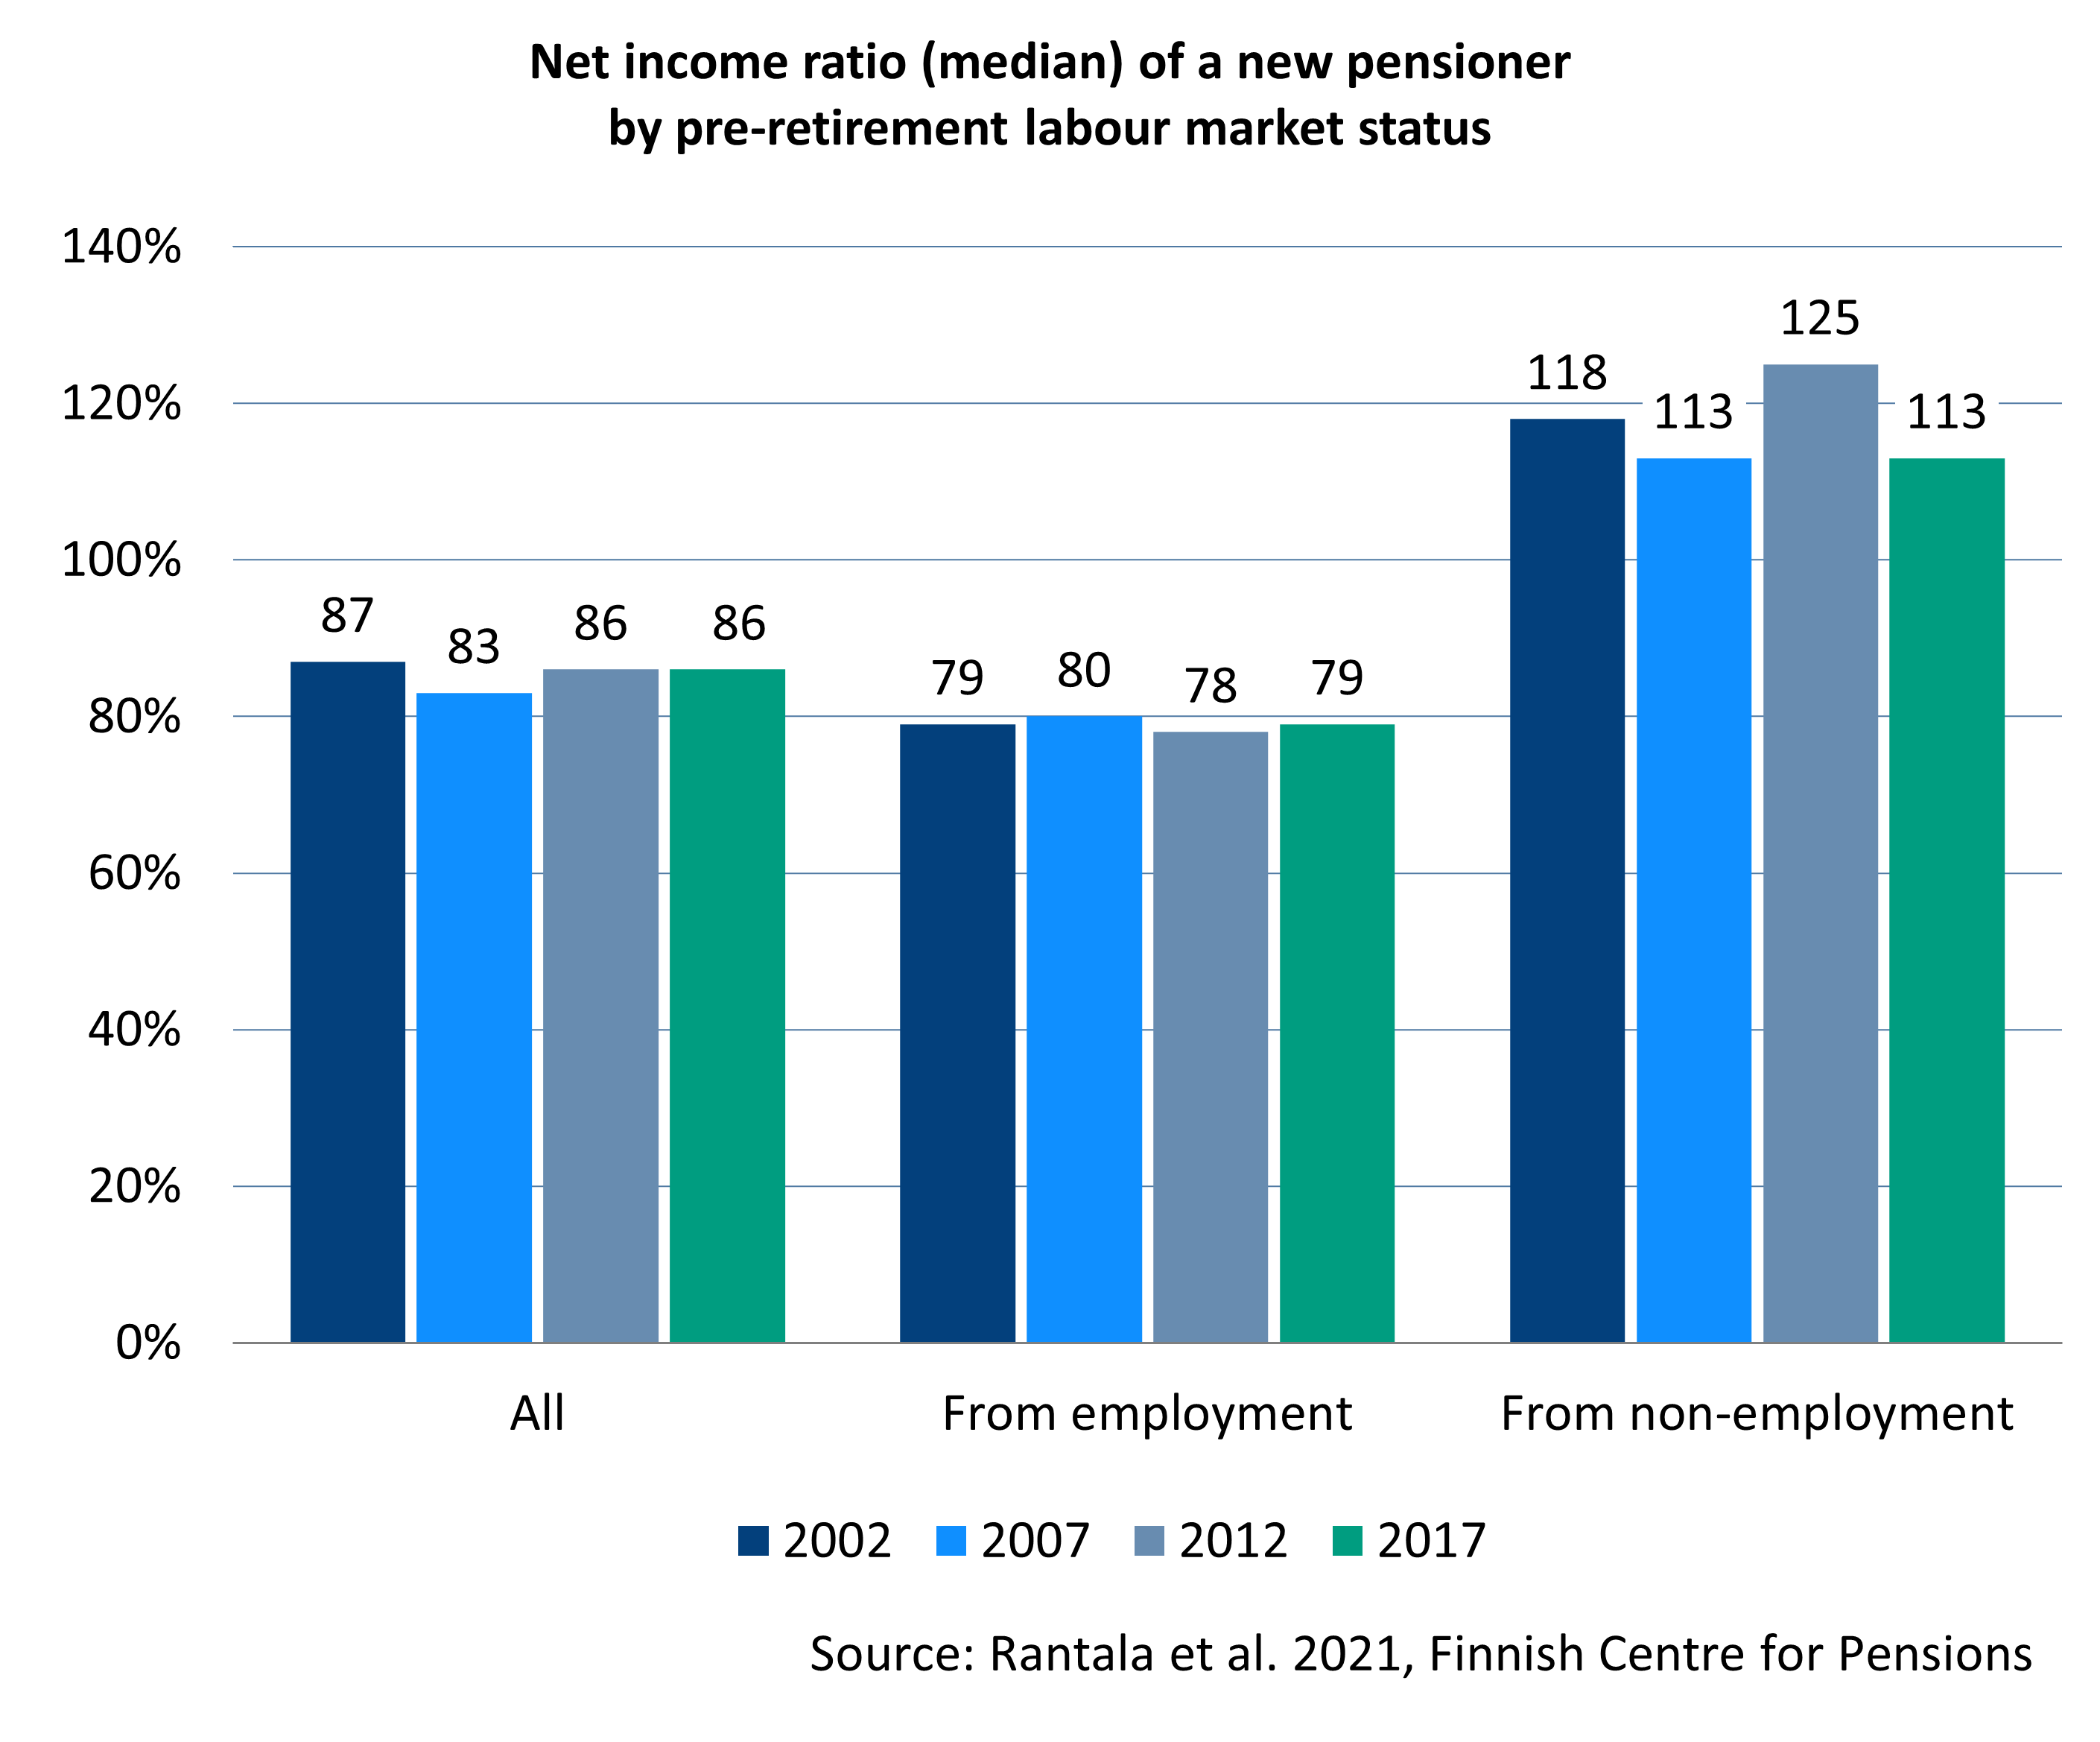
Income levels in retirement are determined by earnings before retirement
Net income refers to the sum remaining after taxes and compulsory contributions have been deducted from gross income. This includes all income, including wages, capital gains, pensions, and various benefits such as the housing benefit, the unemployment benefit and income support.
When moving from employment to retirement, net income typically falls by about one fifth. For those on low incomes, such as the unemployed, net income tends to remain steady or may even increase slightly. However, there is significant variation between individuals.
Publications:
- Ahonen et al 2018 Pensioners’ perceived economic welfare in 2017 (Julkari; summary in English)
- Polvinen et al. 2020. Explanations for economic difficulties among old-age pensioners previously on disability pension (European Journal of Public Health)
- Polvinen et al. 2023. Osatyökyvyttömyyseläkeläisten työssäkäynti ja ansiotyön merkitys toimeentulossa (employment among partial disability pensioners and impact of gainful employment on livelihood) (Työpoliittinen aikakauskirja)
- Polvinen et al. Over-55-year-old current and former disability pensioners’ experiences of financial well-being (Summary in English; Julkari)
- Rantala et al. 2021. How does net income change at retirement? (Summary in English; Julkari)
- Rantala & Laaksonen 2022. Ovatko työkyvyttömyyseläkeläisten eläkkeet pienentyneet? (have the pensions of disability pension recipients become smaller?) (Julkari)
- Rantala et al. 2024. Three layers of the disability pension. Income and income structure of new disability pensioners in 2020 (Summary in English; Julkari)
Household’s income considered when assessing financial wellbeing
In studies on financial wellbeing, income usually refers to the combined earnings of all household members, adjusted for household size using a consumption unit figure. This allows for comparisons between households of different sizes, such as single-person and multiple-person households. For pensioners, this means that both the pensioner’s own income and the income of others living in the same household are included.
Most often, the focus is on disposable income, that is, the net income available to all household members after taxes and other deductions. Gross income, on the other hand, refers to the total income before taxes and other deductions.
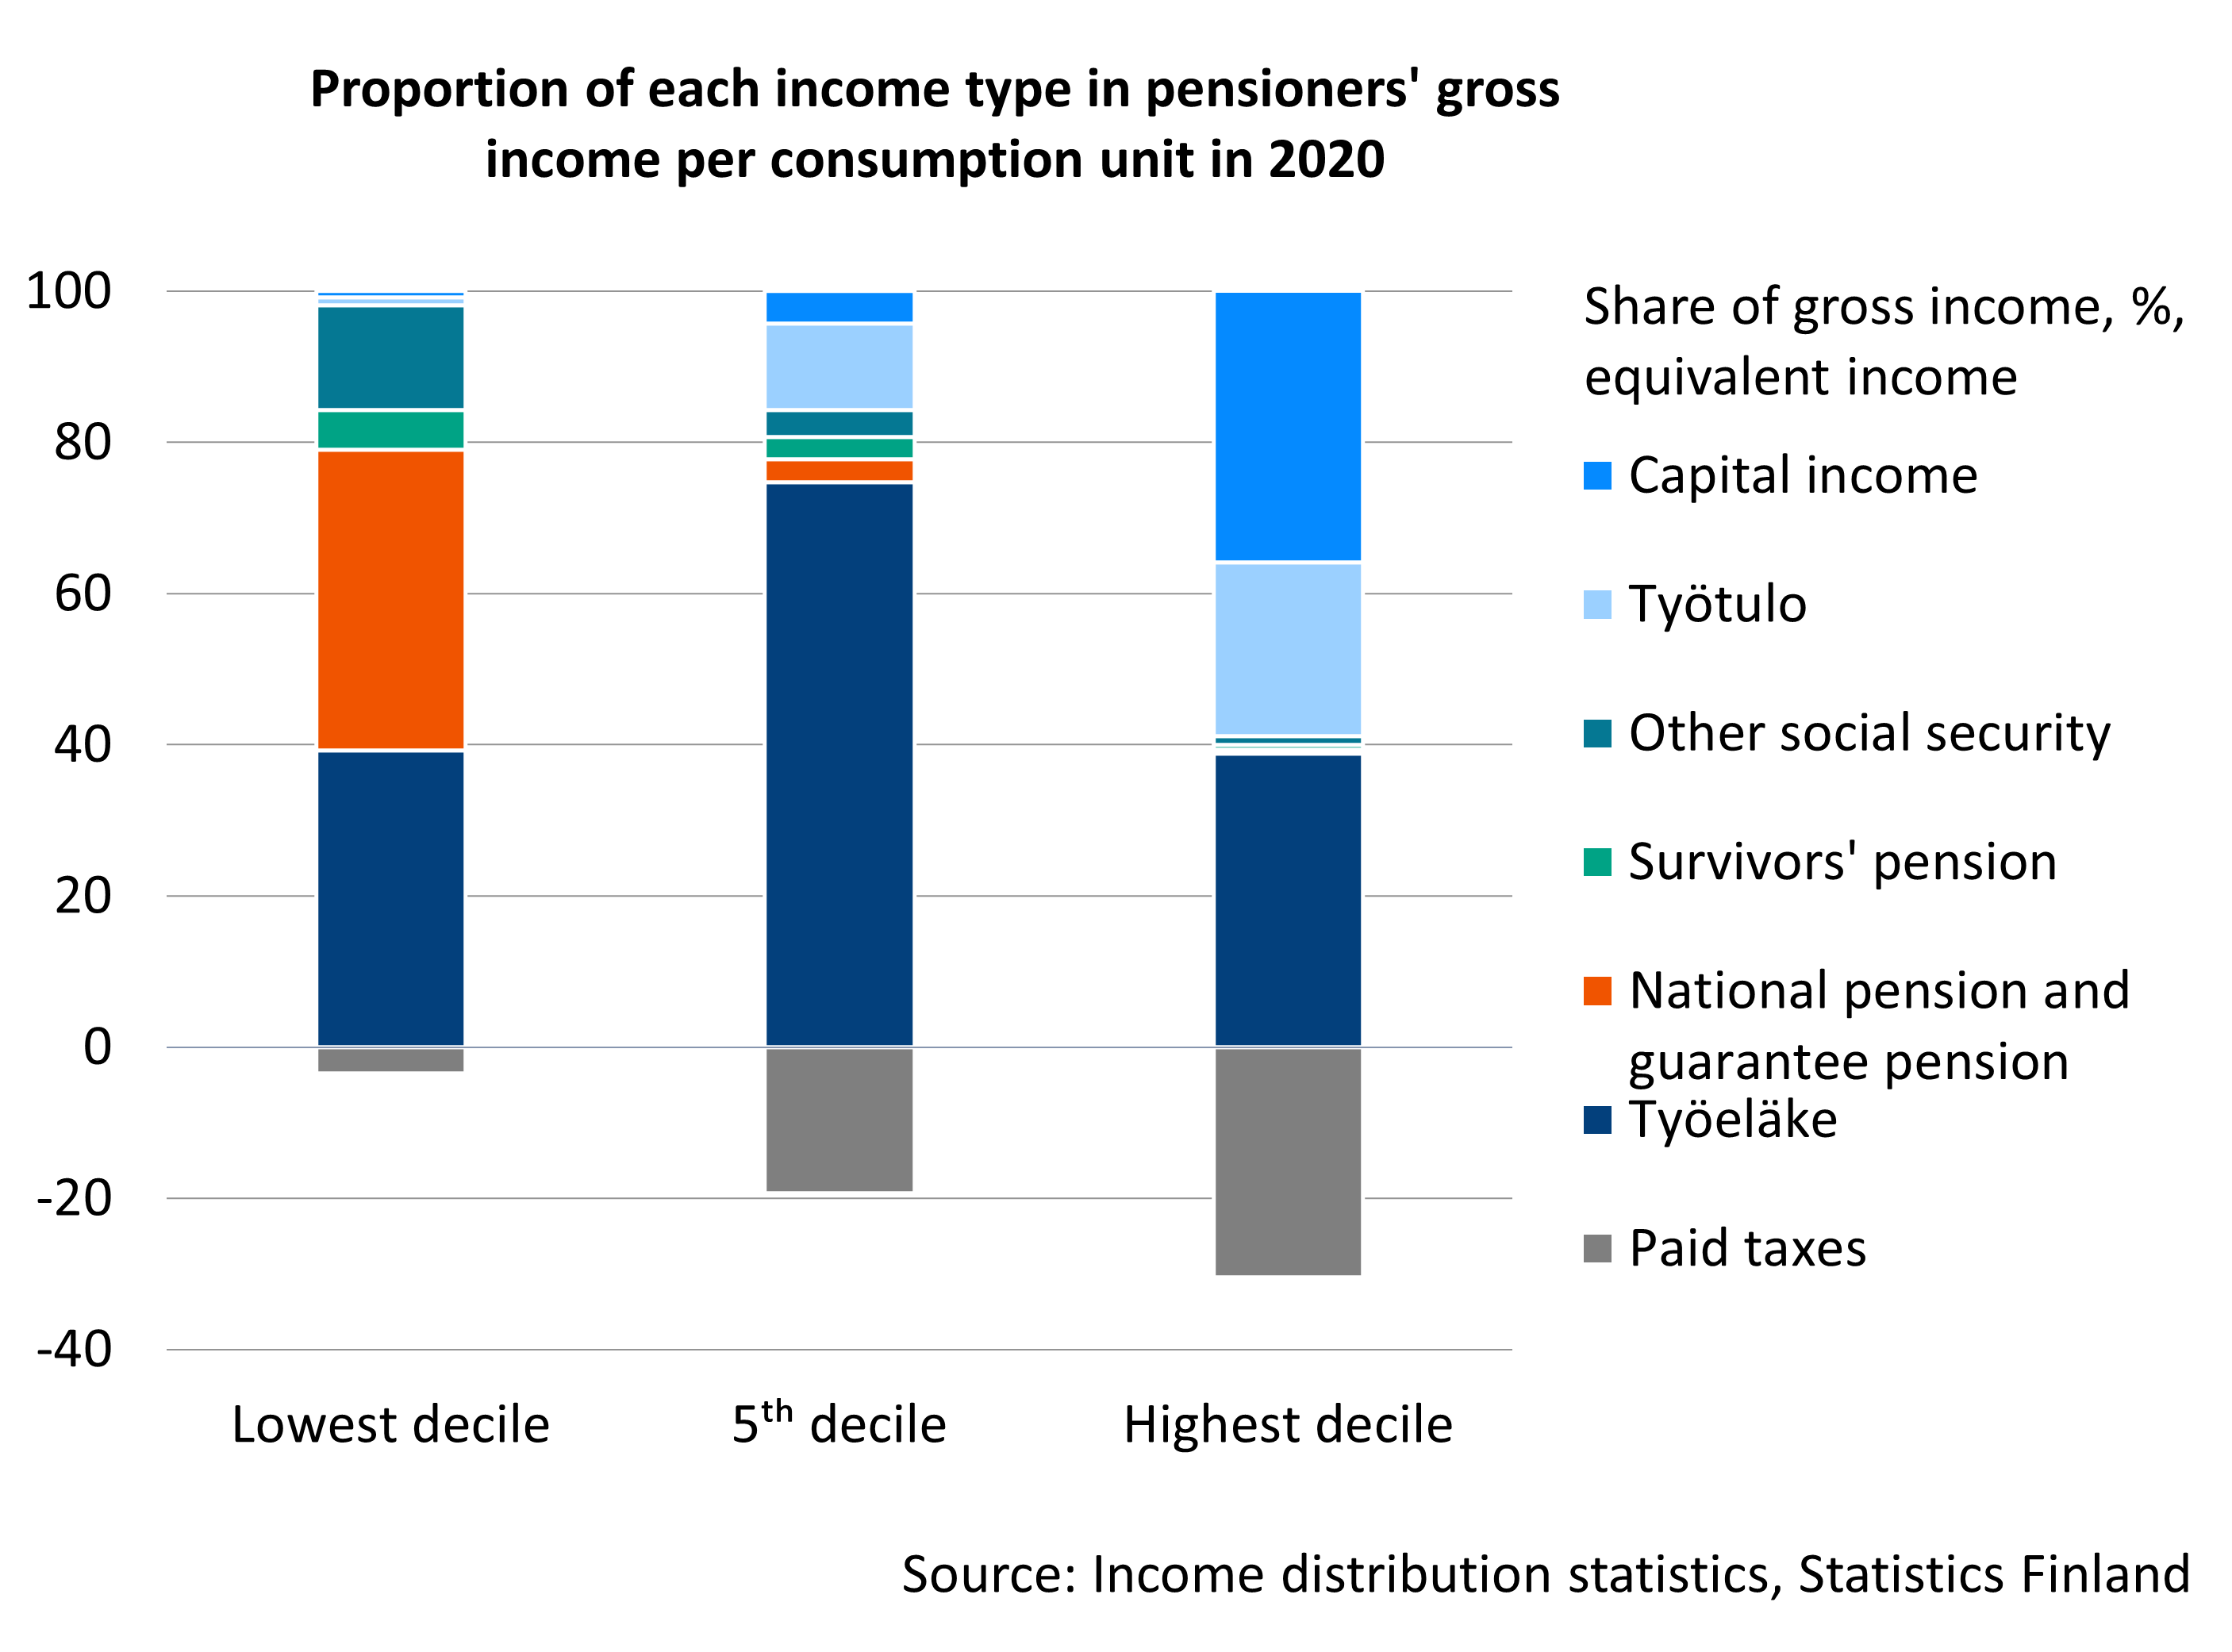
Pensions form the main source of income for pensioner households
The main source of income for pensioner households is pensions, particularly earnings-related pensions. For instance, in 2020, earnings-related pensions accounted for around three-quarters of the gross income of a typical pensioner. Overall, statutory pension benefits (including earnings-related pensions, national pensions, the guarantee pension, and survivors’ pensions) made up roughly 80 per cent of the gross income in pensioner households.
In addition to their pensions, pensioners may also have earnings from work, capital income and various benefits, such as pensioners’ housing allowance. Those in the lowest income decile rely more heavily on minimum income security, while middle-income pensioners depend mainly on earnings-related pensions. Those in the top income decile rely mainly on capital income and income from work.
In 2020, the gross income of pensioners with an average income were more than twice that of the gross income of those in the lowest income decile, but less than a third of the level seen in the highest income decile. Taxation helps to reduce income disparities, so differences in disposable income are not as pronounced as those in gross income.
Pensioners’ disposable income is two thirds of the income of wage-earners
Pensioners’ disposable income is lower than that of wage-earners and the self-employed, but higher than that of the unemployed. Throughout the 2000s, pensioners’ disposable income has been around two thirds of wage-earners’ income. This difference has remained stable in the last few decades. Compared to the income of the unemployed, the income of pensioners has been an ample one third higher in the 2000s.
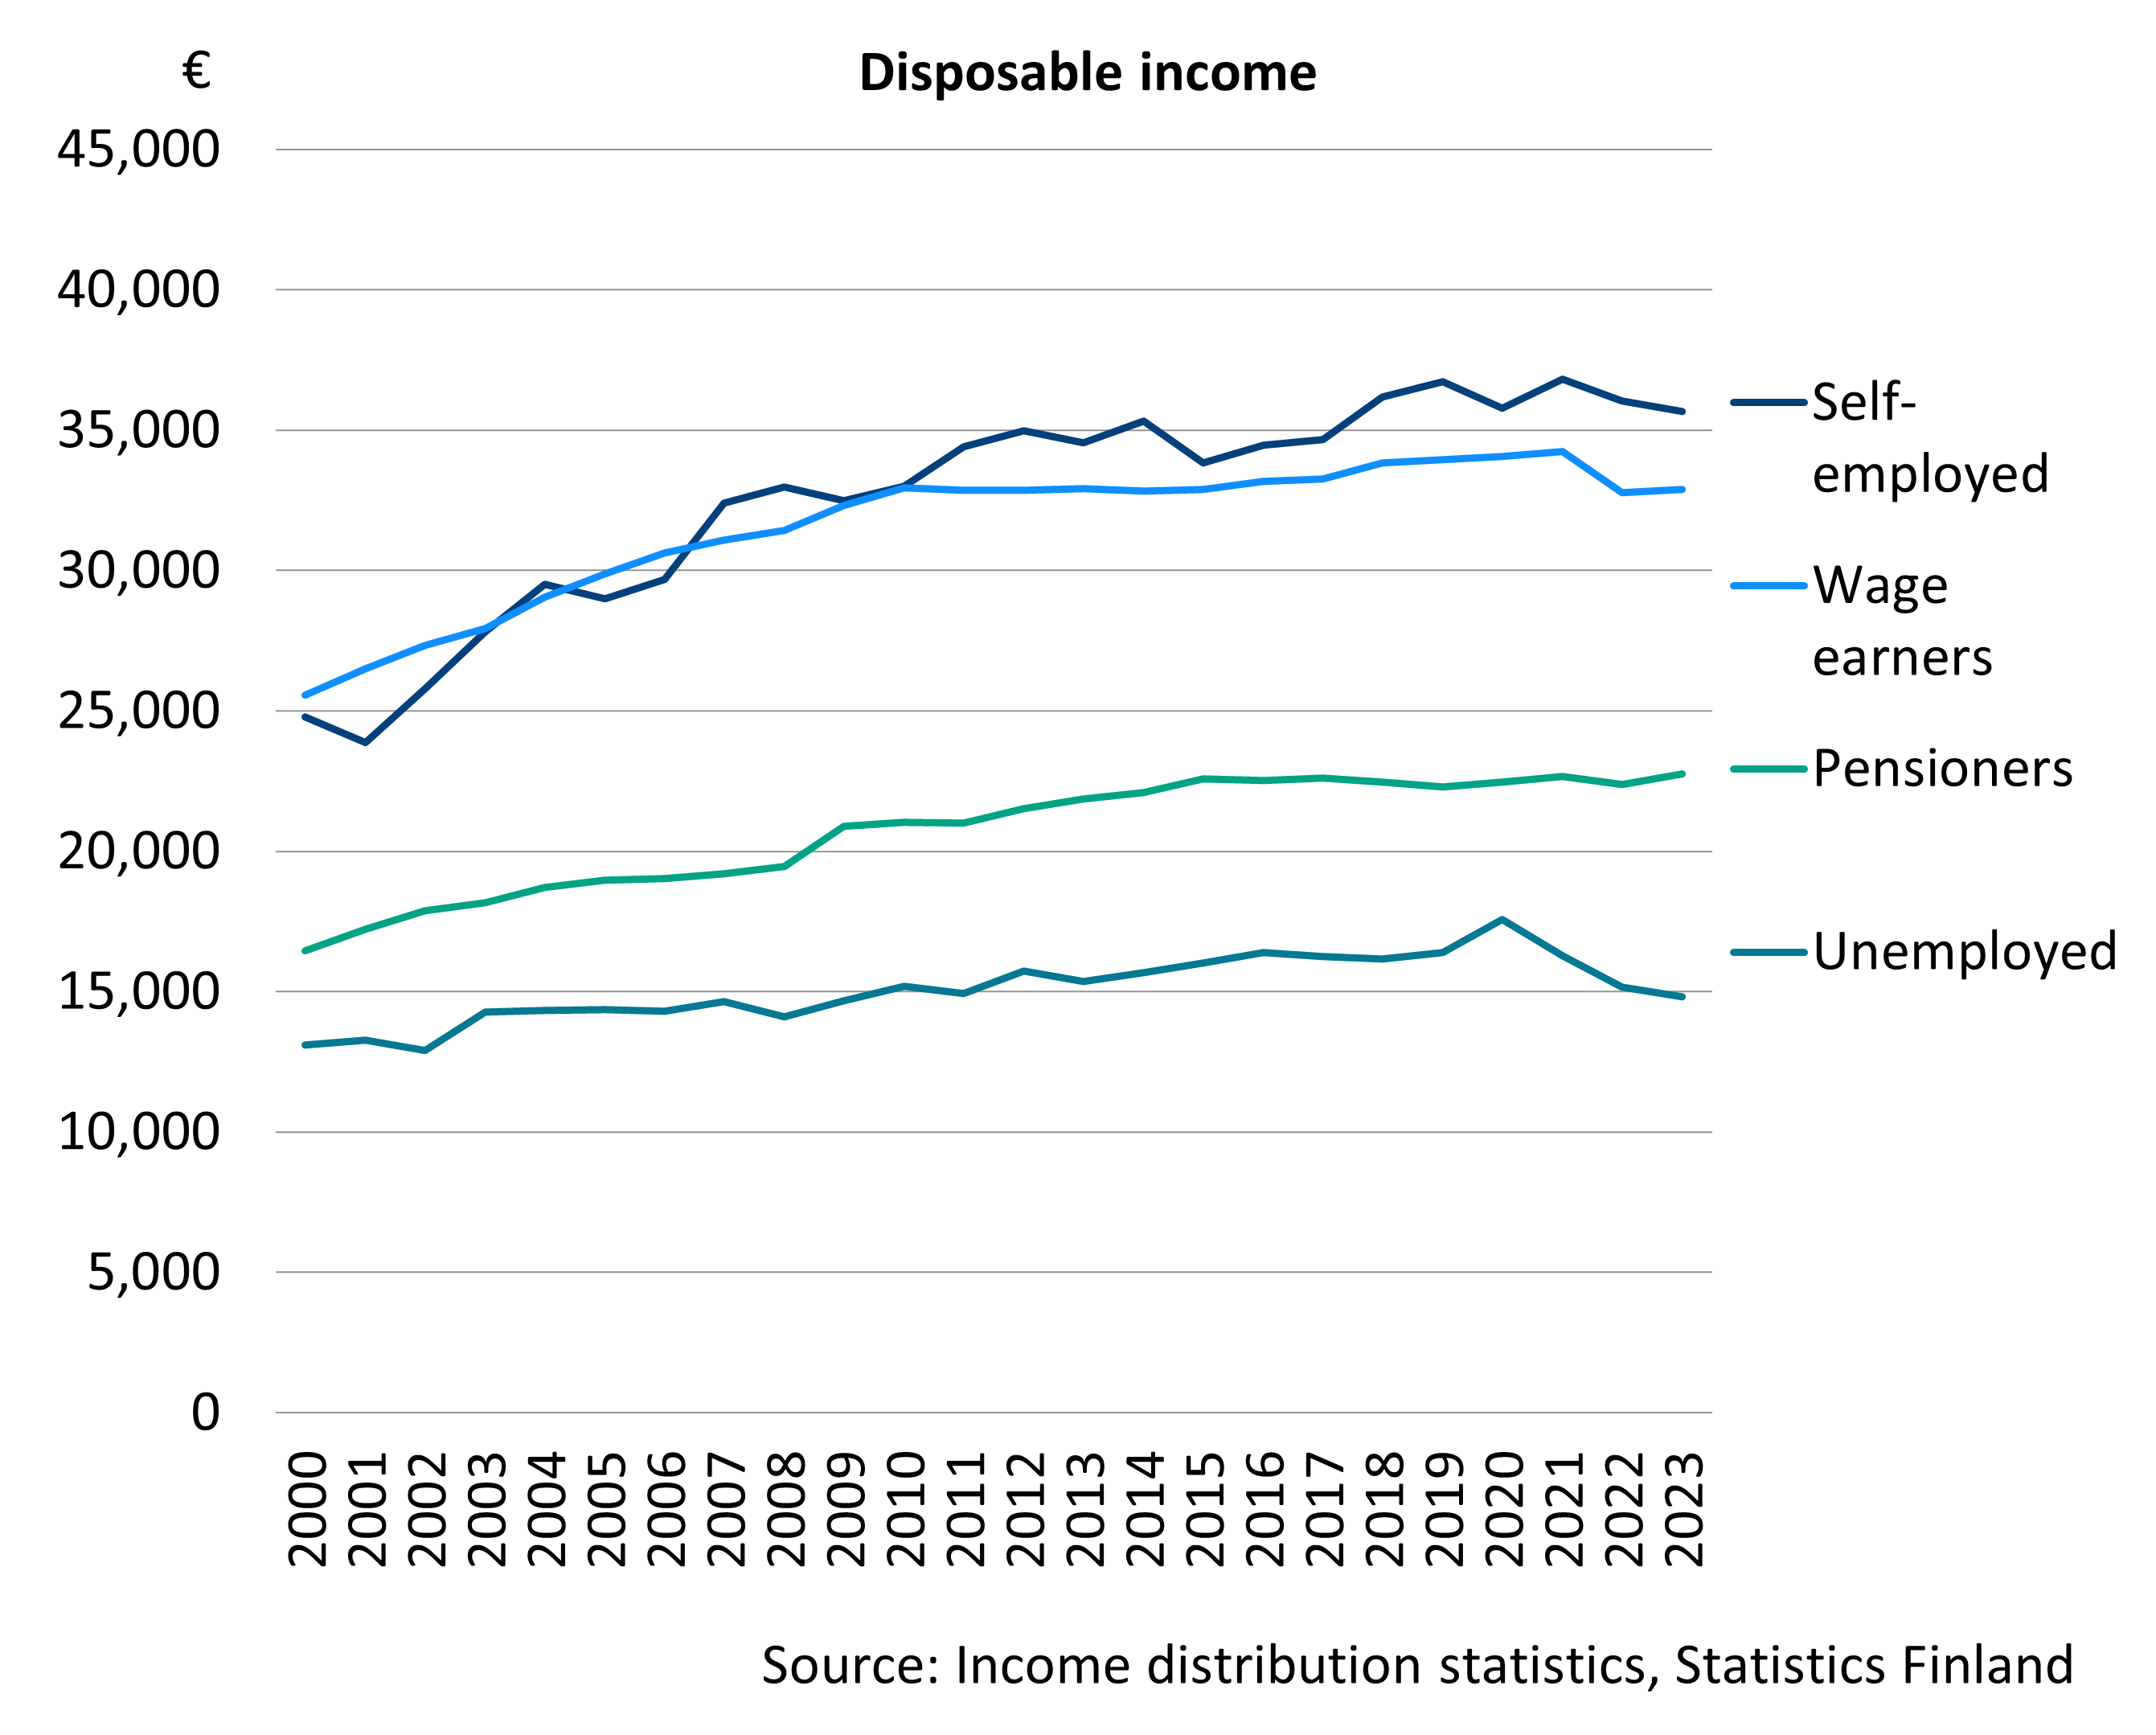
Graph’s “Disposable income” data in accessible Excel file.
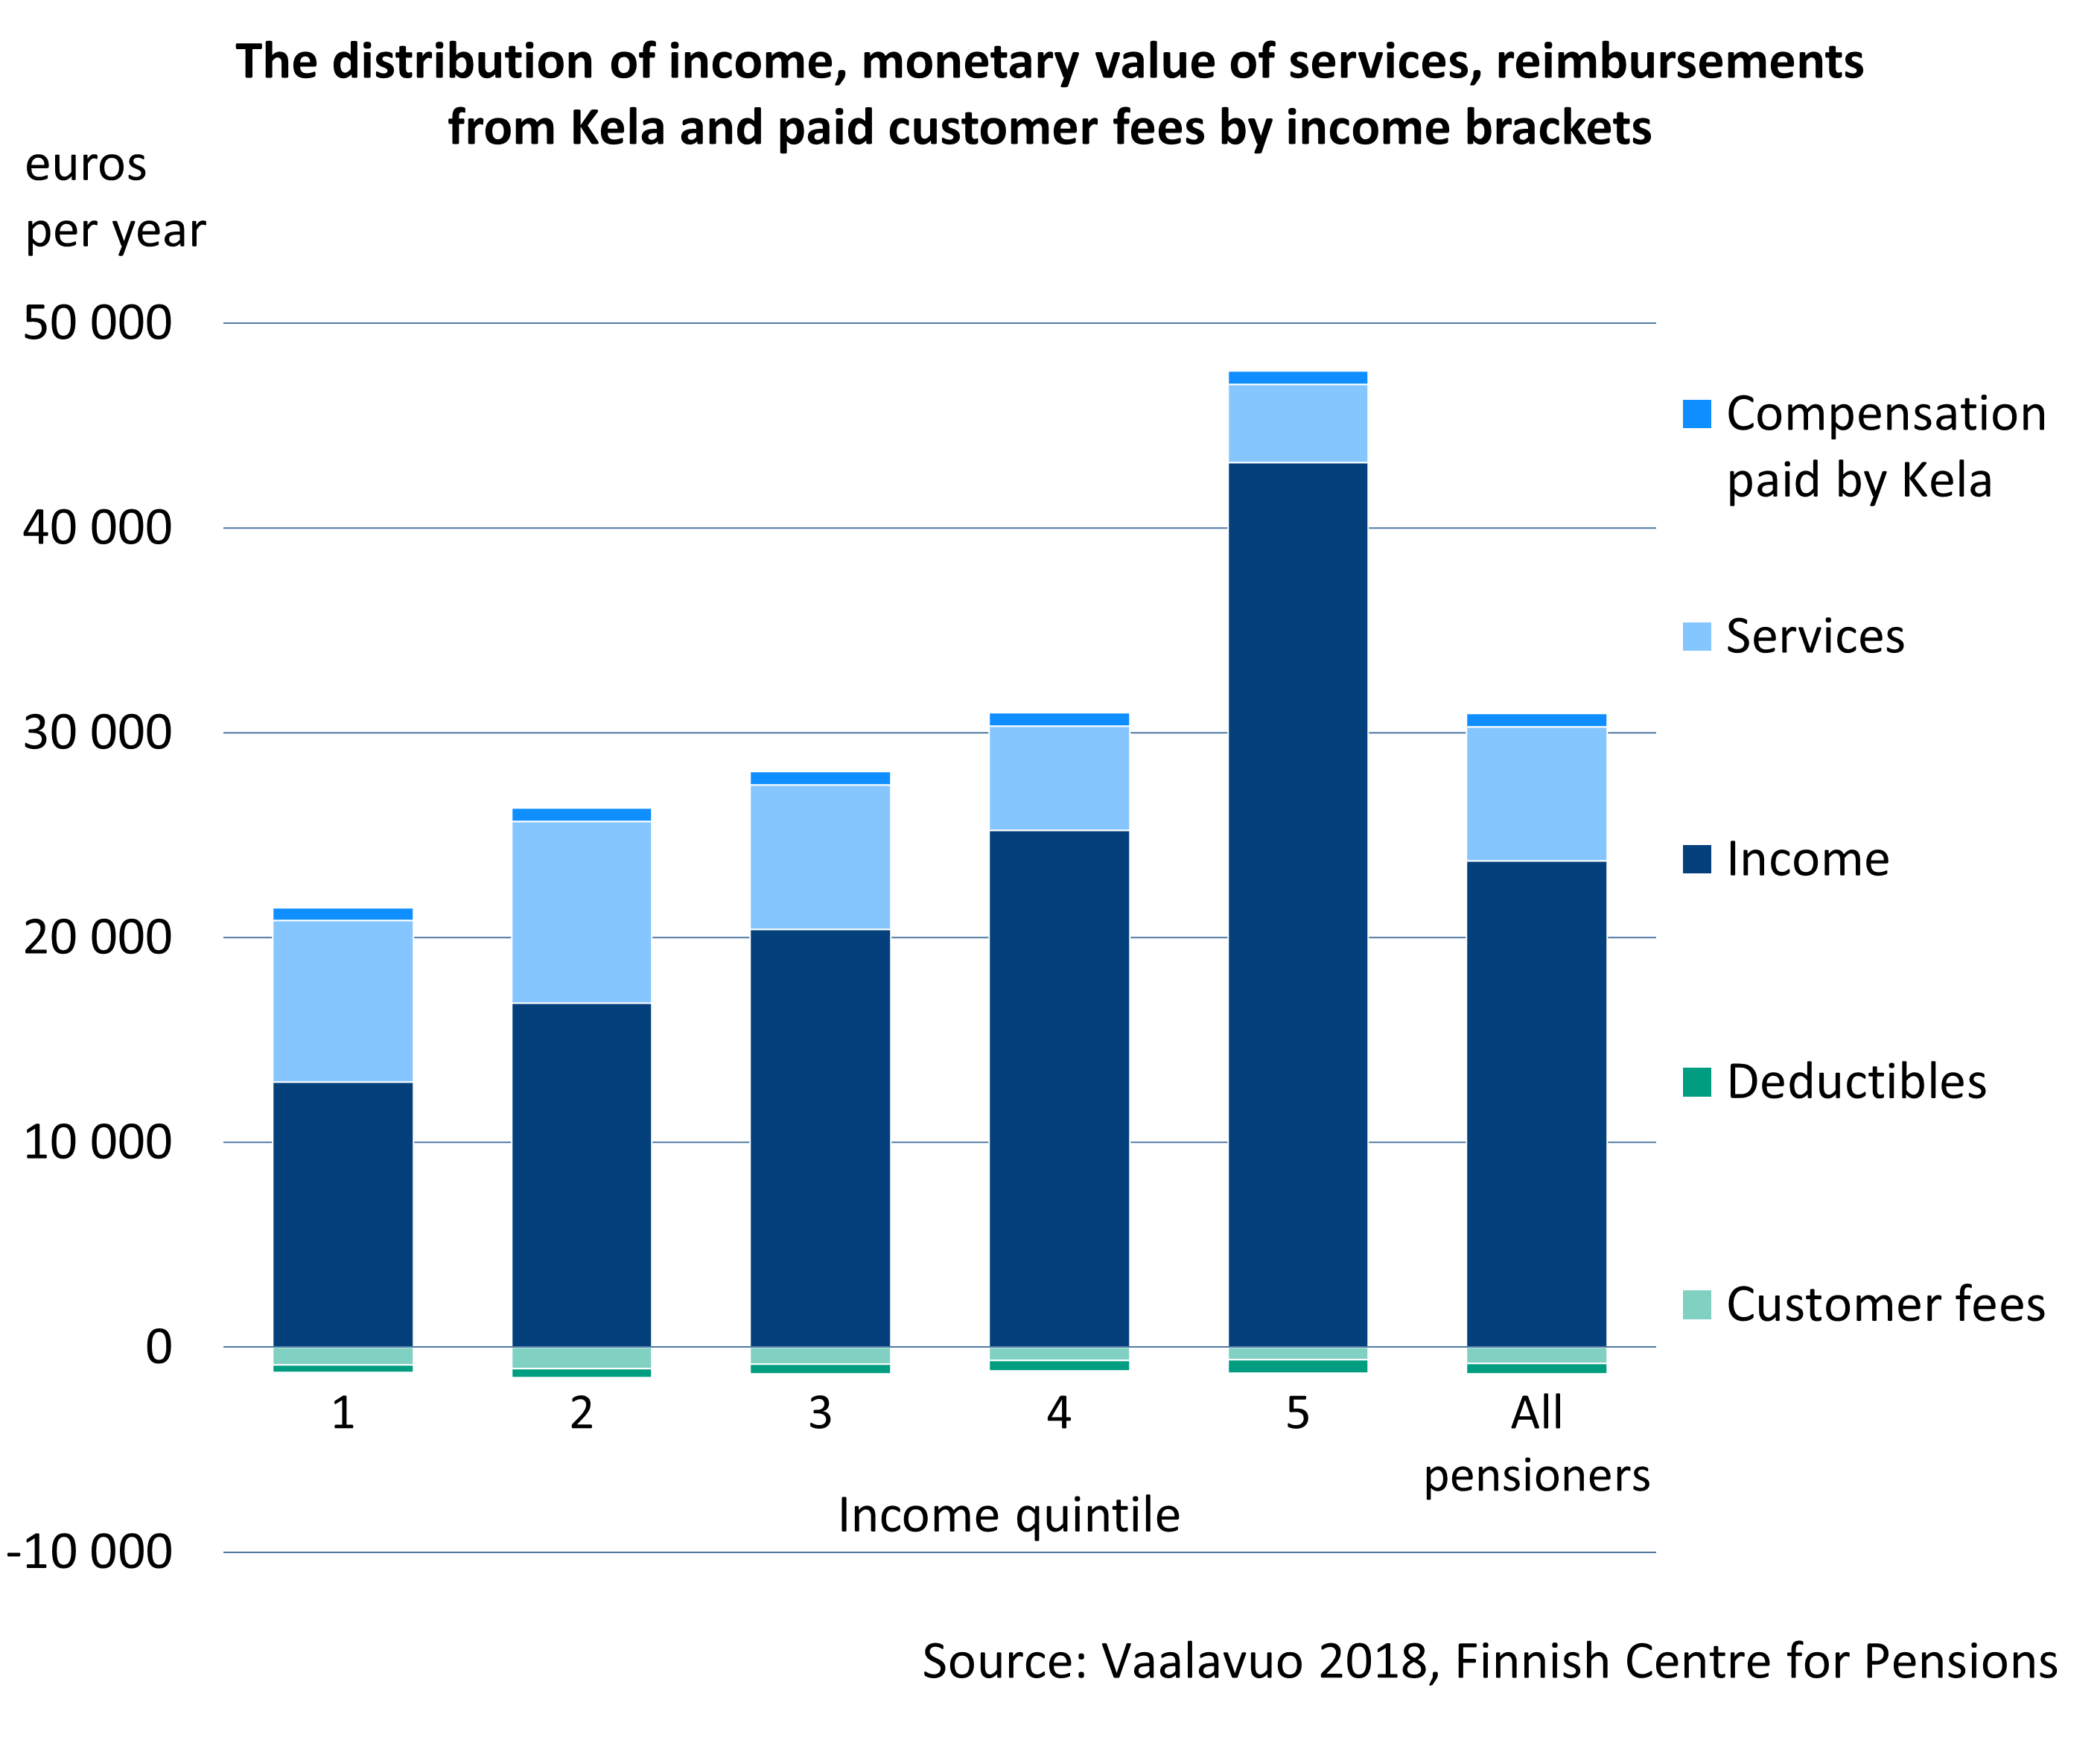
Benefit from public services evens out income gaps between pensioners
Public services support people’s wellbeing. The services can be viewed as part of the public income redistribution system. Low-income pensioners use public social and health services to a larger extent than do high-income pensioners. Relative to the disposable income, the monetary value of the services was particularly significant in the lower income quintile.
Publications:
- Kuivalainen et al. 2022. Pensions and pensioners’ economic wellbeing – Development from 1995 to 2020 (Julkari, summary in English)
- Kuoksa ym. 2024. Vanhuuseläkkeelle siirtyneet ja eläkkeiden taso taustatekijöiden mukaan vuosina 2006, 2011, 2017 ja 2023 (new pensioners on an old-age pension and pension levels in 20006, 2011, 2017, and 2023 by background factors; Julkari)
- Rantala 2020. Studies on the dynamics of low income and economic well-being of pensioners in Finland in 1995–2014 (Julkari, summary in English)
- Rantala et al. 2023. Tulojen muuttuminen eläkkeelle siirryttäessä (changes in income at retirement; Julkari)
- Vaalavuo 2018. The Impact of Social and Health Care Services on Retiree’s Income (Julkari, summary in English)
Pensioners’ income can also be reviewed from the point of view of consumption, assets and perceived economic welfare. This gives a more comprehensive picture of pensioners’ financial situation.
Wealth can supplement income
Savings and assets can supplement income and act as a buffer against unexpected expenses. Wealth typically accumulates with age through debt repayment and other forms of saving. The value of existing assets can increase over time. Assets can also be acquired through inheritance. The assets of pensioners have increased, especially as the large post-war baby boom generations have reached retirement age. The net assets of Finnish households are now highest among households of people aged over 54.
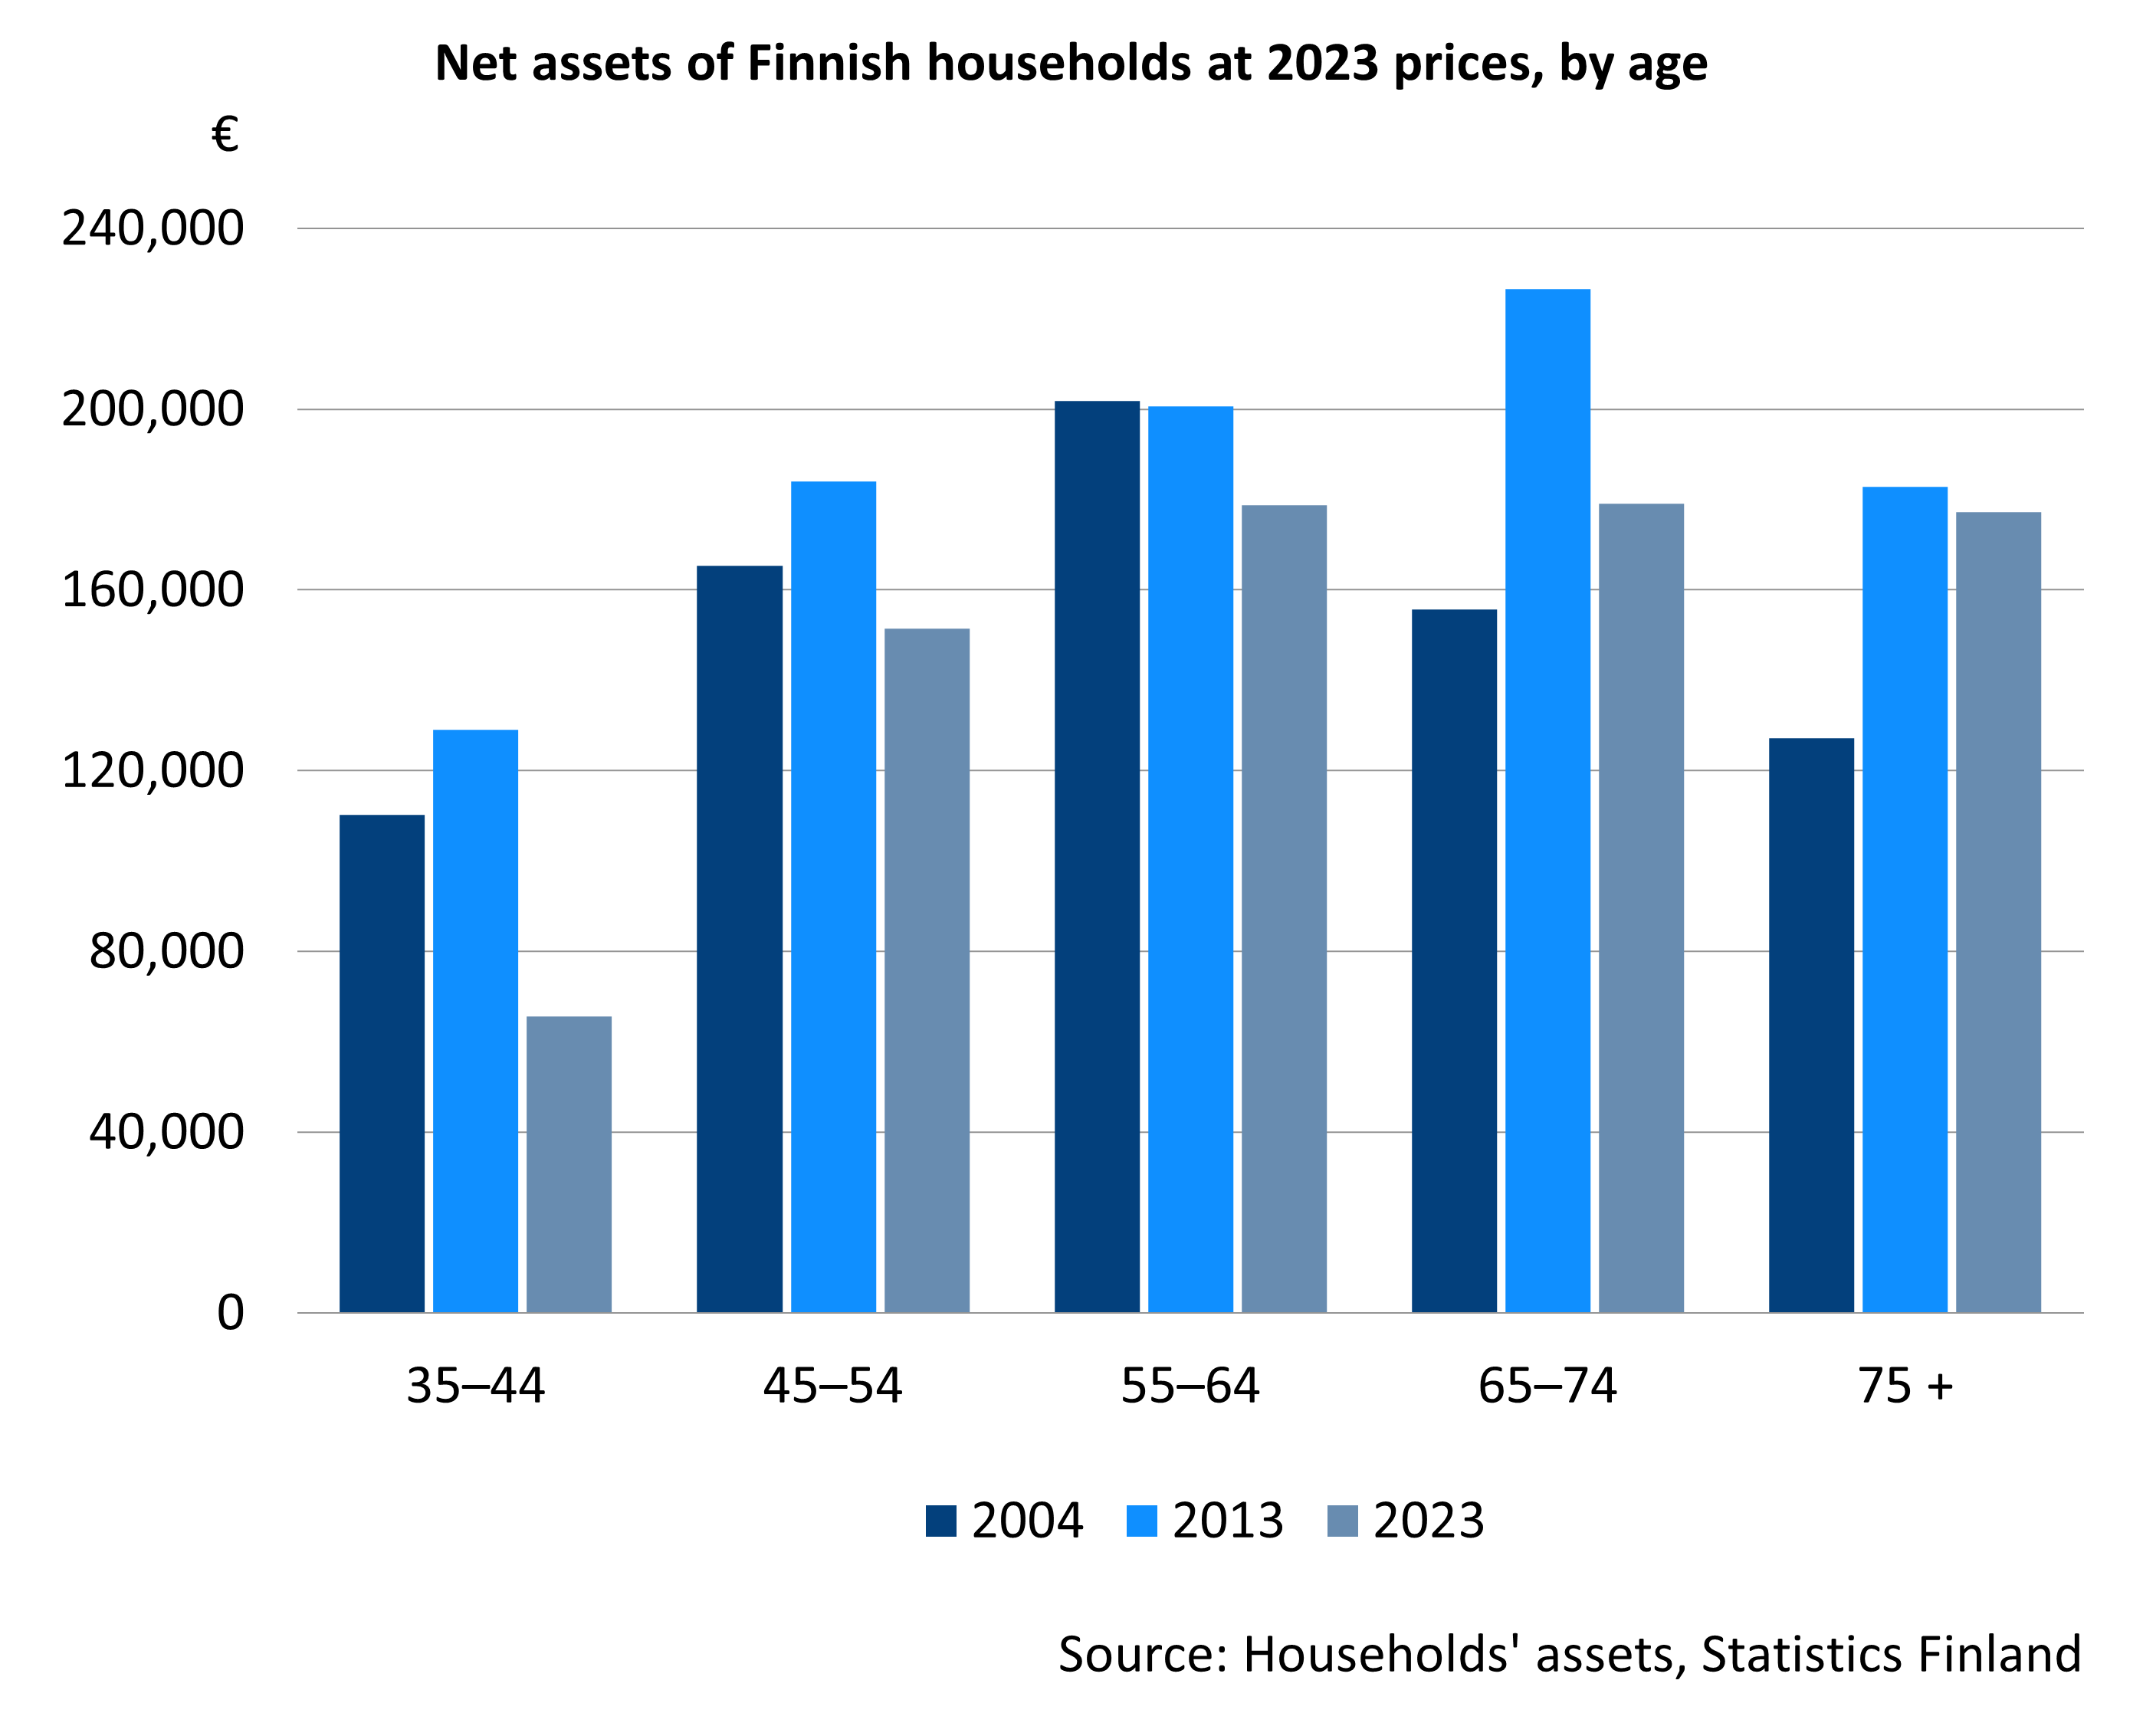
Graph’s “Net assets of Finnish households at 2023 prices, by age” data in accessible Excel file.
In the 2000s, the consumption habits of pensioners have approached those of the working-age population. Relatively, the total consumption expenditure of persons aged 75 or over has grown the most in the last decade. For instance, in 2012, the average total consumption expenditure of households of people aged 75–84 was around 60 per cent of that of households of people aged 45–54. By 2022, the share had risen to 85 per cent.
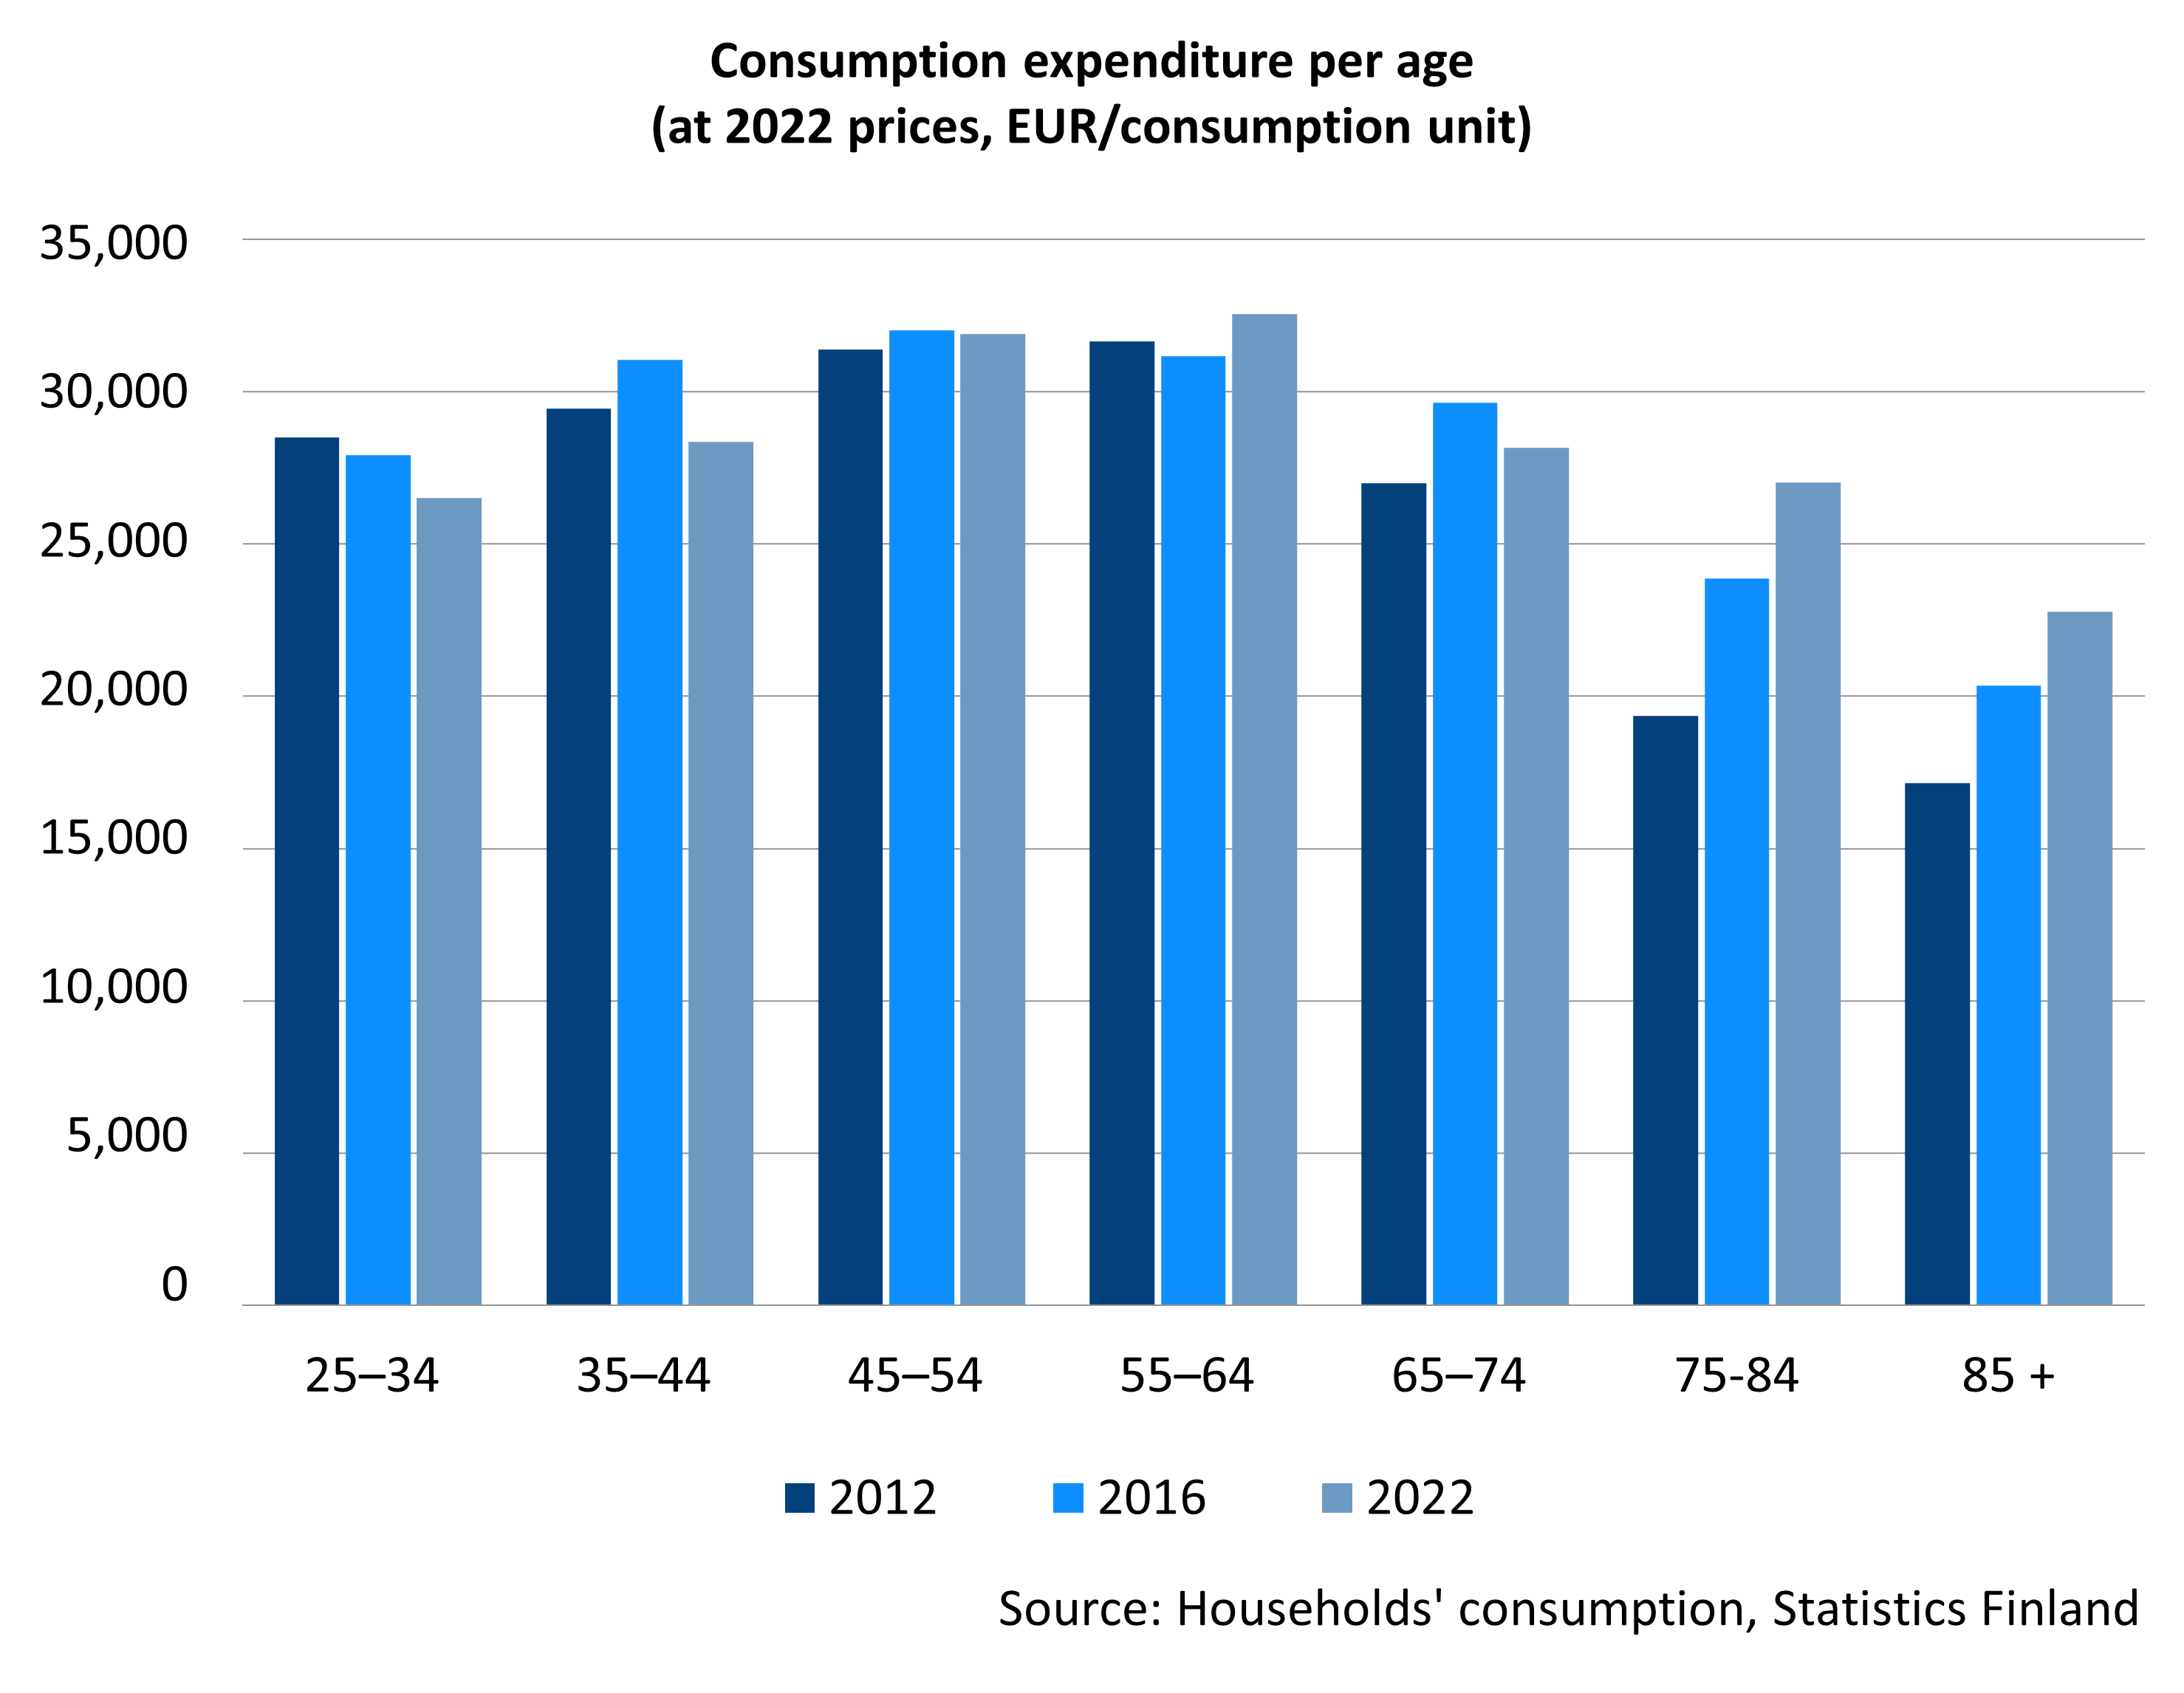
Graph’s “Consumption expenditure per age” data in accessible Excel file.
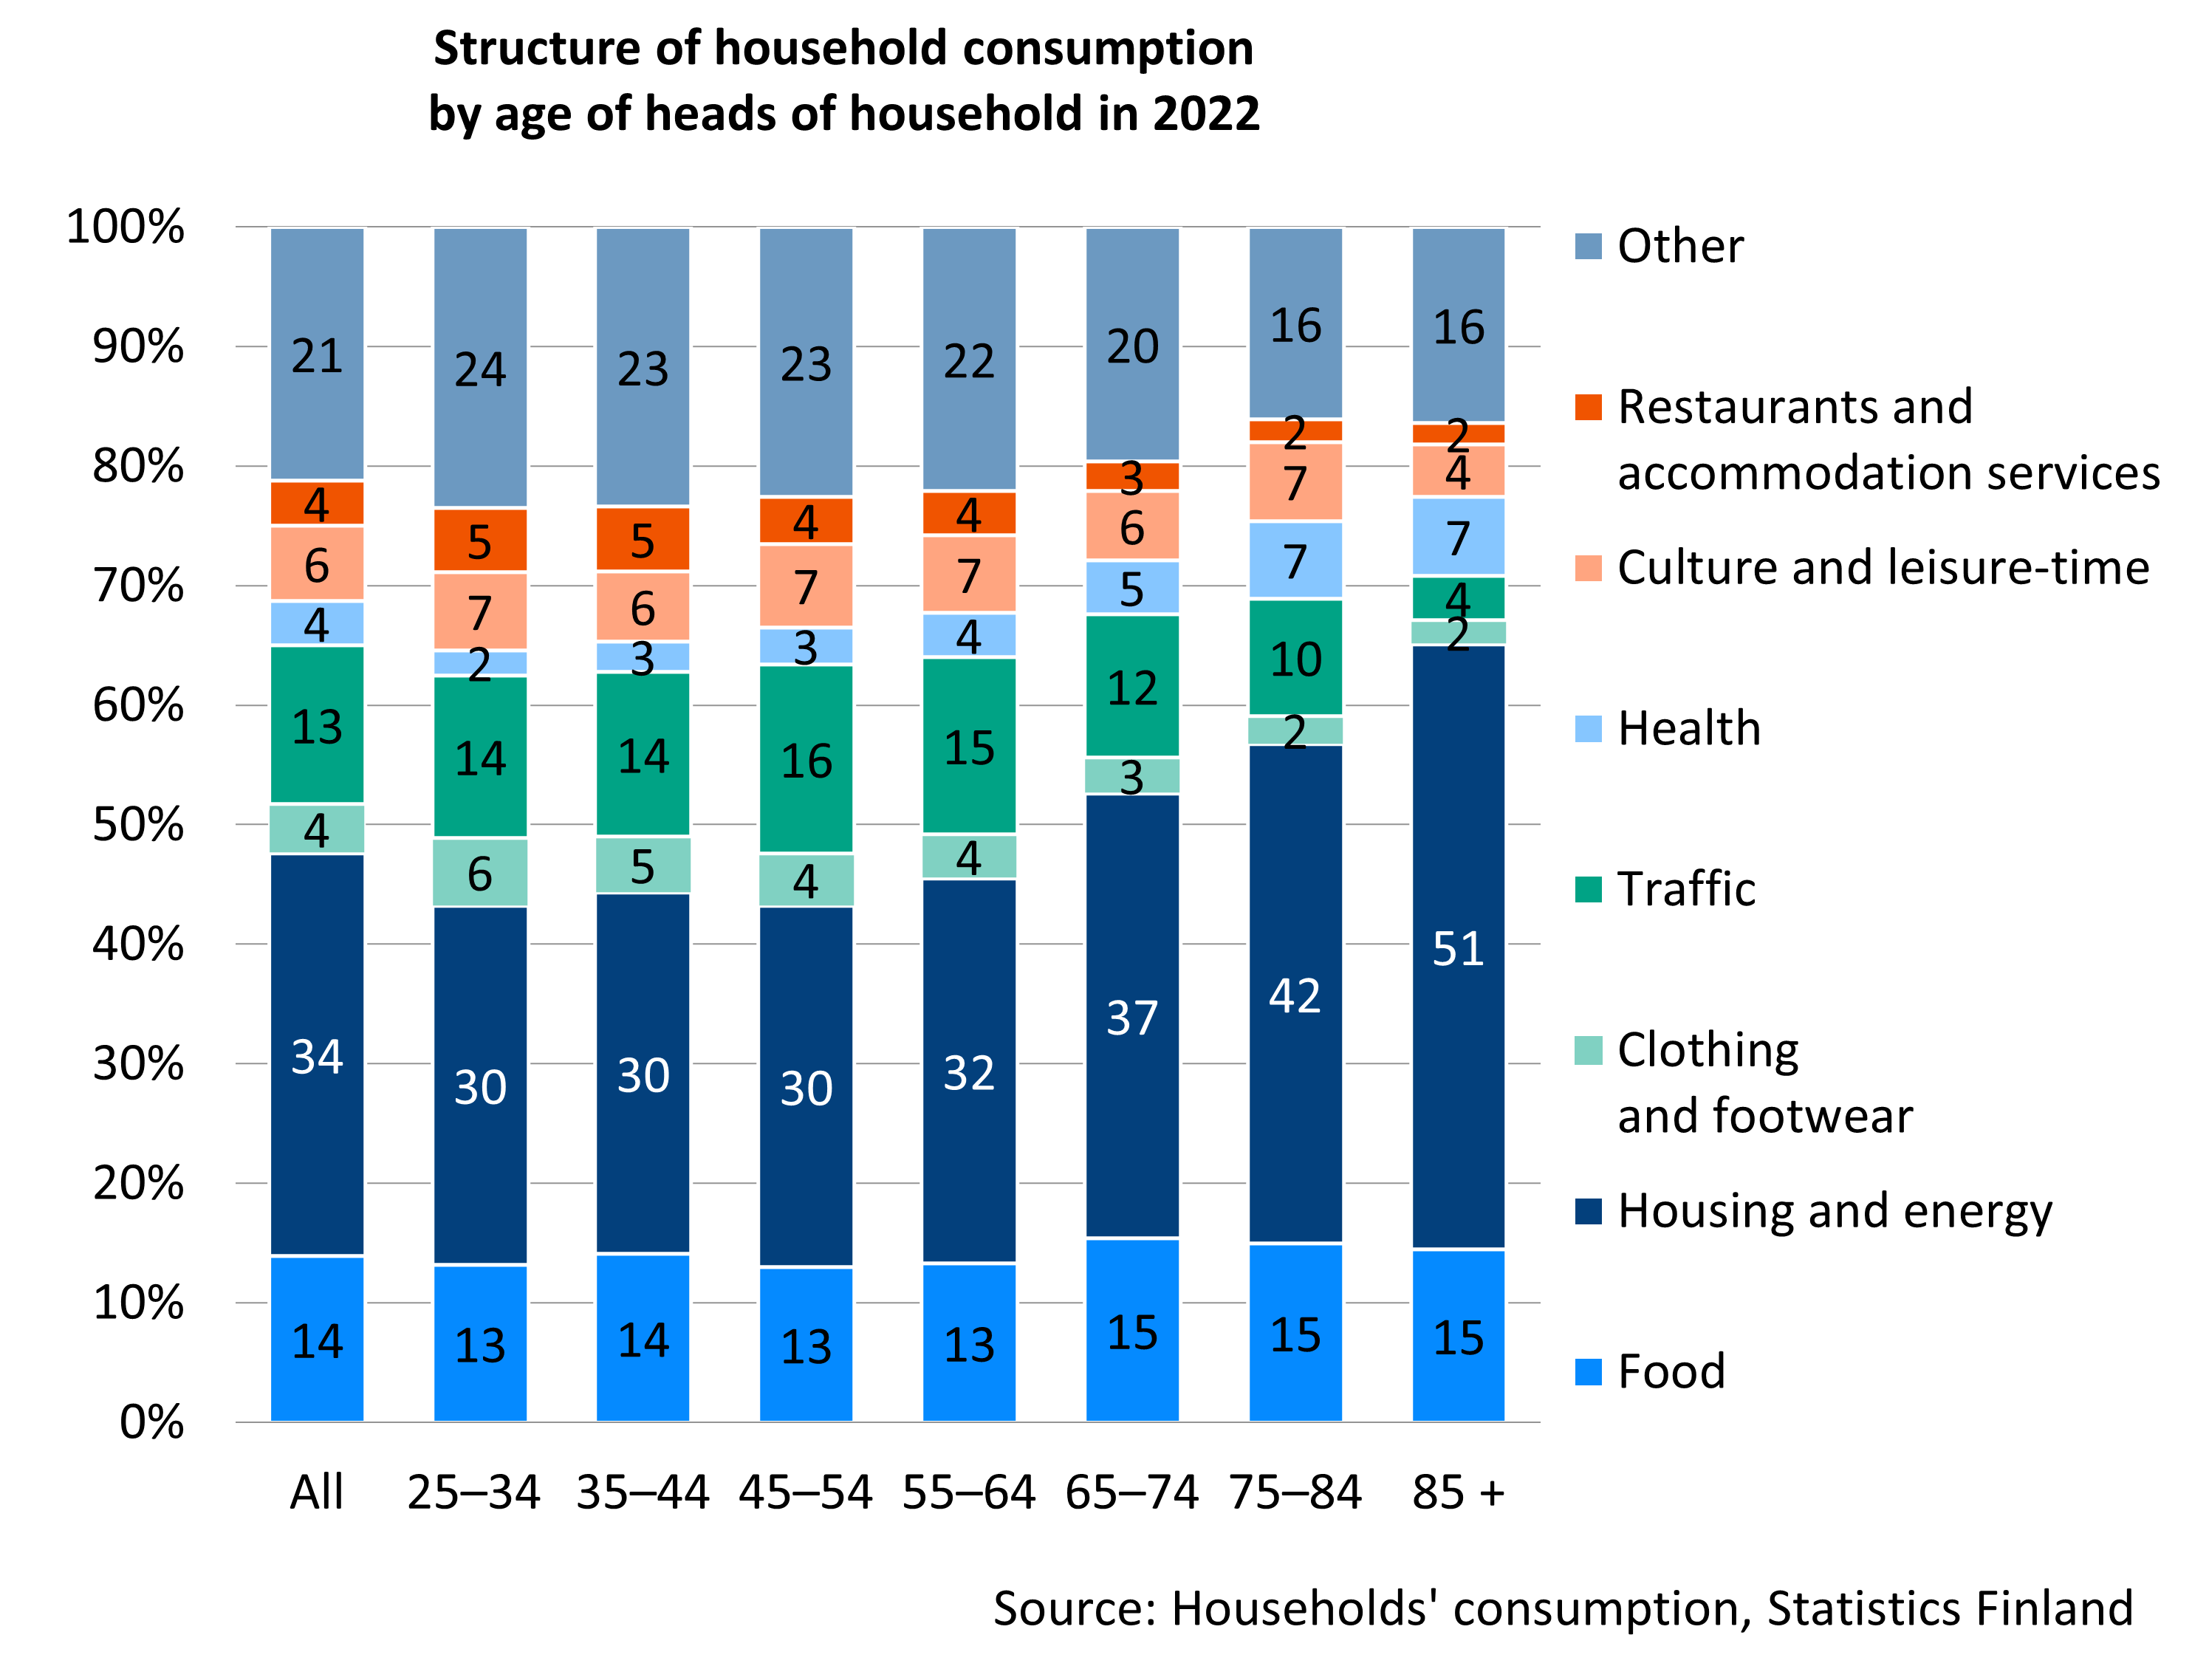
Housing expenses form the largest consumption expenditure item in all age groups. Housing expenses make up a particularly high share for the older population: in 2022, they formed more than 40 per cent of the total expenditure for those aged between 75 and 84 years and 50 per cent of those aged 85 and over. Health care expenses are also highlighted in the consumption of the older age groups. In contrast, the share of expenses for leisure time, restaurant and hotel services, as well as transportation and communication is clearly lower for this age group than for the younger ones.
Publications:
- Ahonen 2022. Vanhuuseläkeläiskotitalouksien varallisuus ja velat vuonna 2020 [Wealth and debts of pensioner households in 2020, in Pensions and pensioners’ economic wellbeing – Development from 1995 to 2020] (Julkari)
- Ahonen 2023. Suomalaisten vanhuuseläkeläisten varallisuus ja taloudellinen tyytyväisyys [Finnish pensioners’ assets and financial satisfaction] (Julkari)
- Ahonen 2025. Economic well-being of old-age pensioners: Income, consumption, wealth, subjective well-being, and household structure (Summary in English; Julkari)
- Ahonen & Tenhunen 2025. Onko eläkeikäisten kulutus lähentynyt työikäisten kulutusta? : Kulutustason ja sen rakenteen kehitys eri ikäisillä vuosina 1985–2022 (has the consumption of pensioners become more similar to that of the working-age population: the development of consumption levels and their structure among different age groups from 1885 to 2022; Julkari)
Making ends meet often perceived easy, and few compromise often on consumption
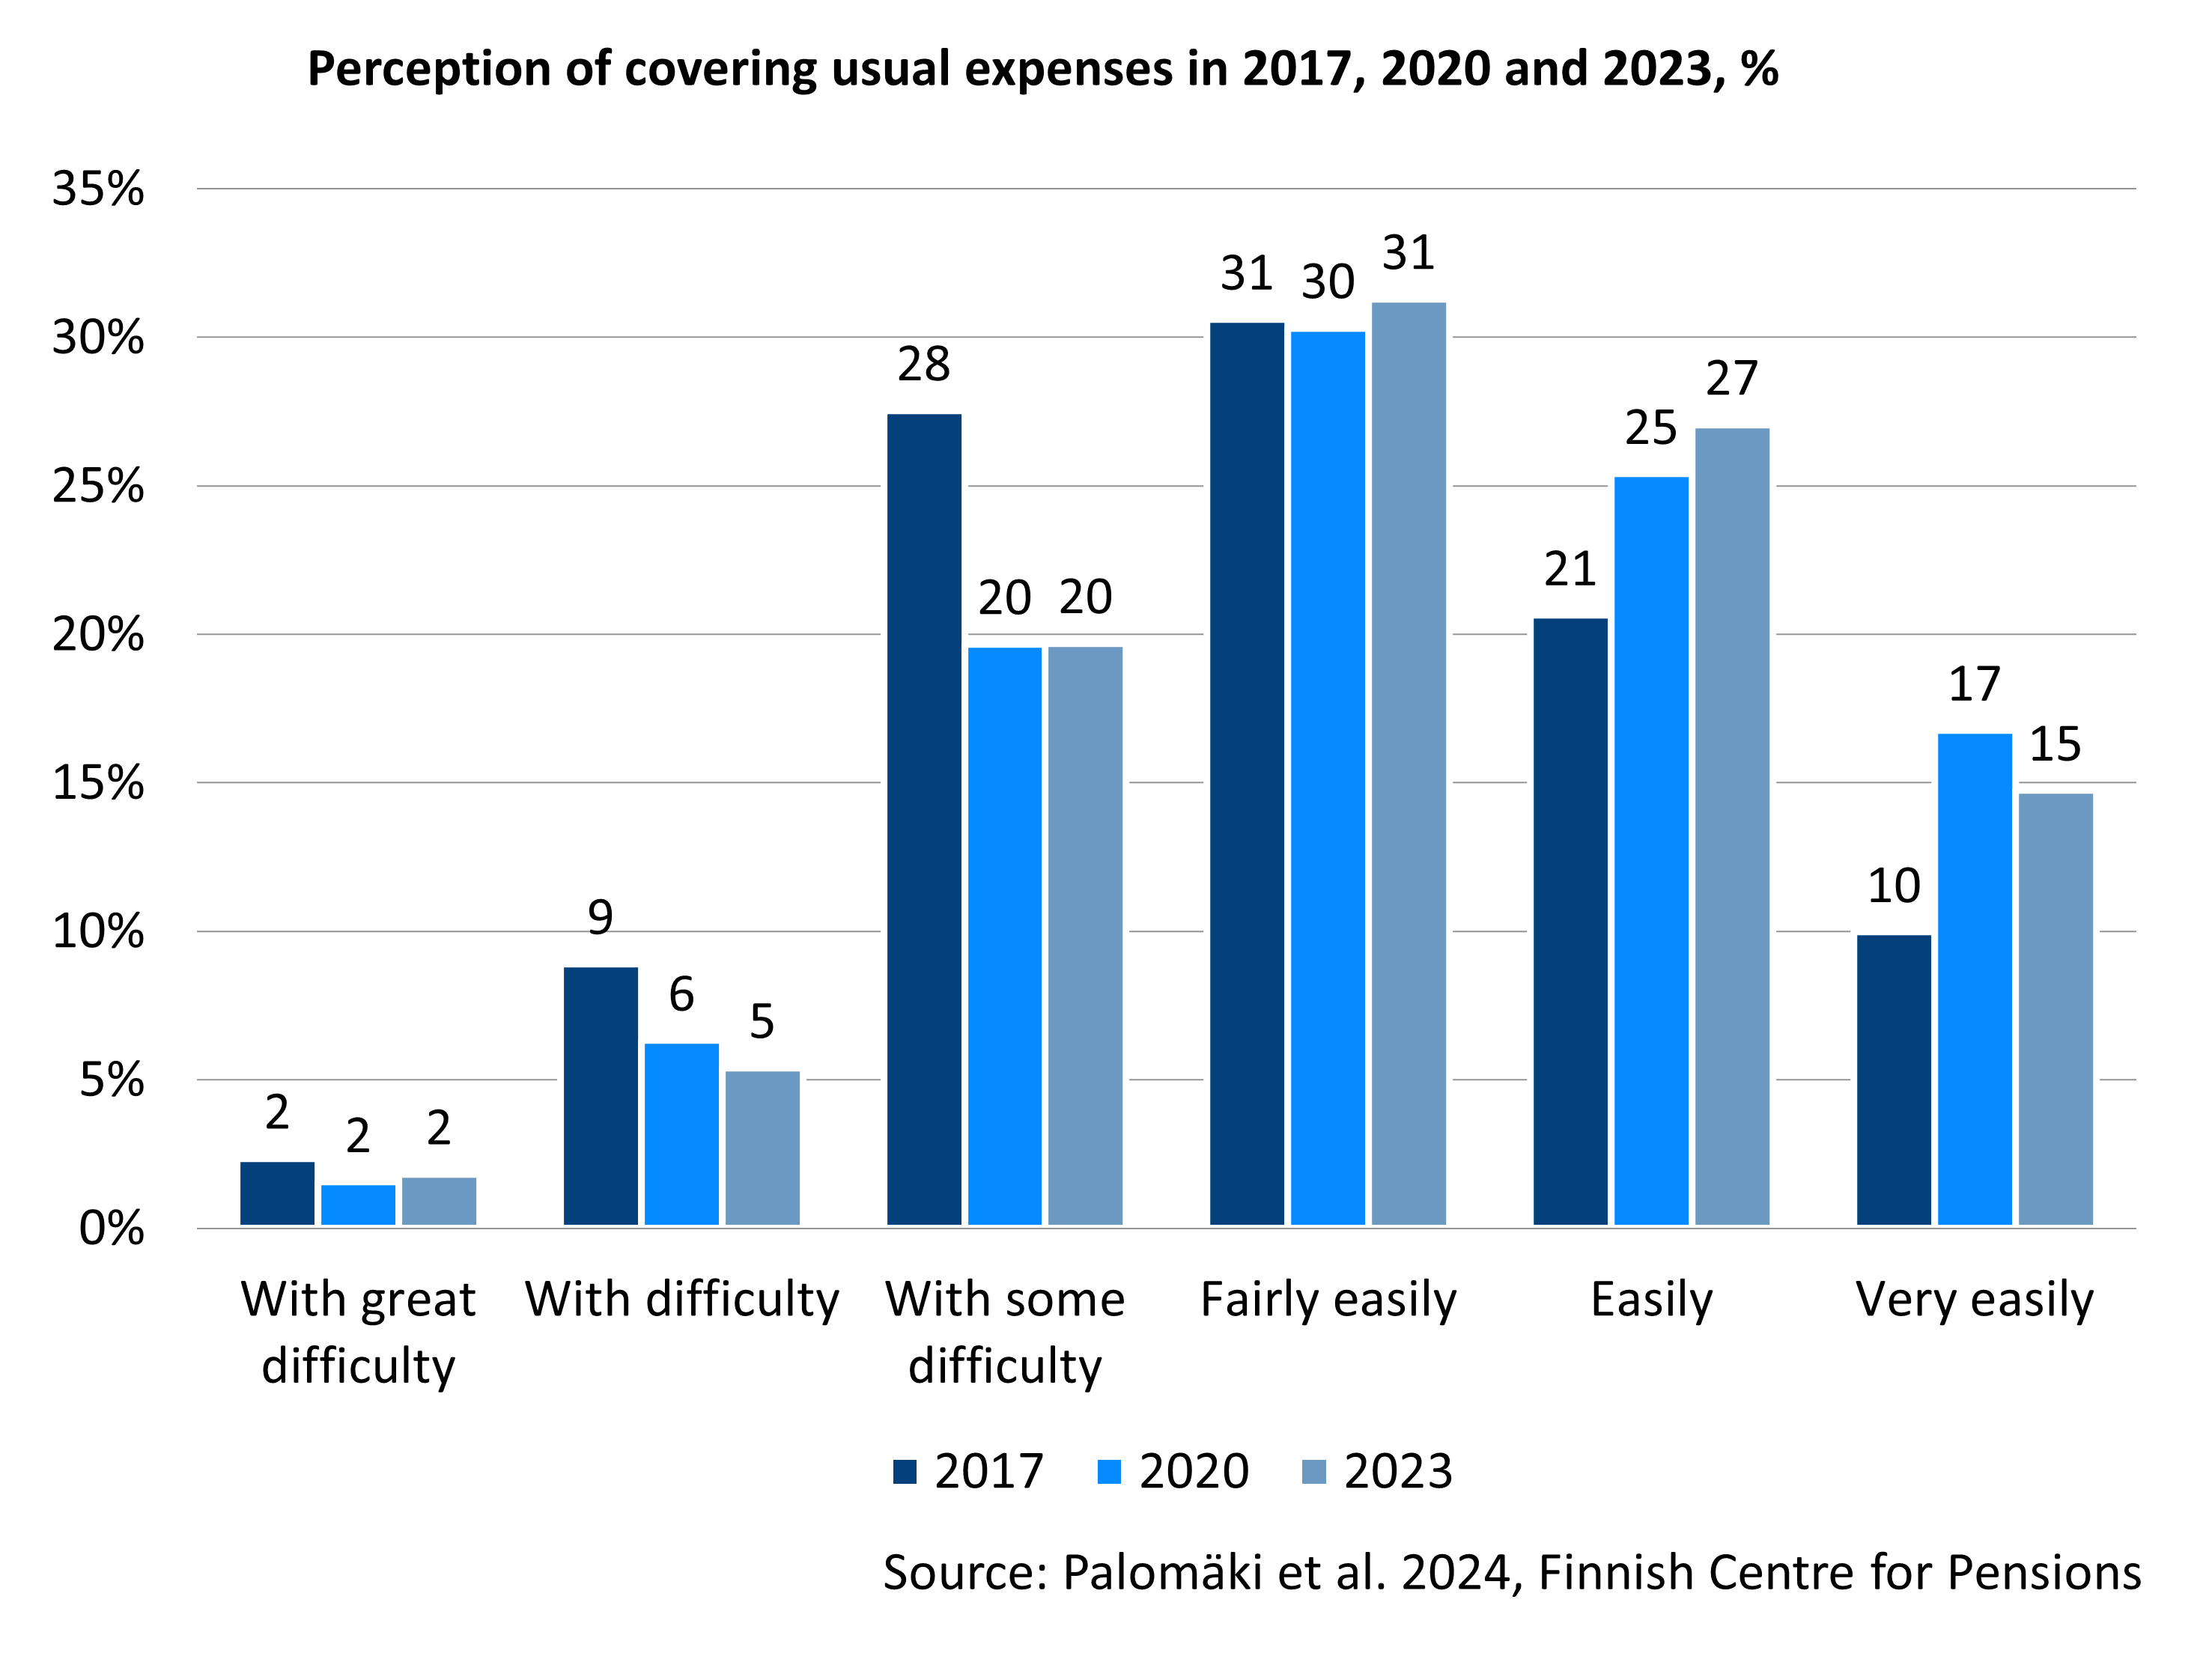
In 2023, most pensioners found it at least somewhat easy to make ends meet, but around one third reported at least some degree of financial strain. Most of the difficulties were minor. Around 10 per cent of pensioners experienced more serious financial strain. In 2023, pensioners found it difficult to make ends meet as often as in 2020 but less often than in 2017.
Financial strain was experienced more frequently than average among individuals who perceive themselves to be in poor health, belong to the lowest income third, live in rental accommodation, live alone, and those under 65 years who are predominantly on a disability pension.
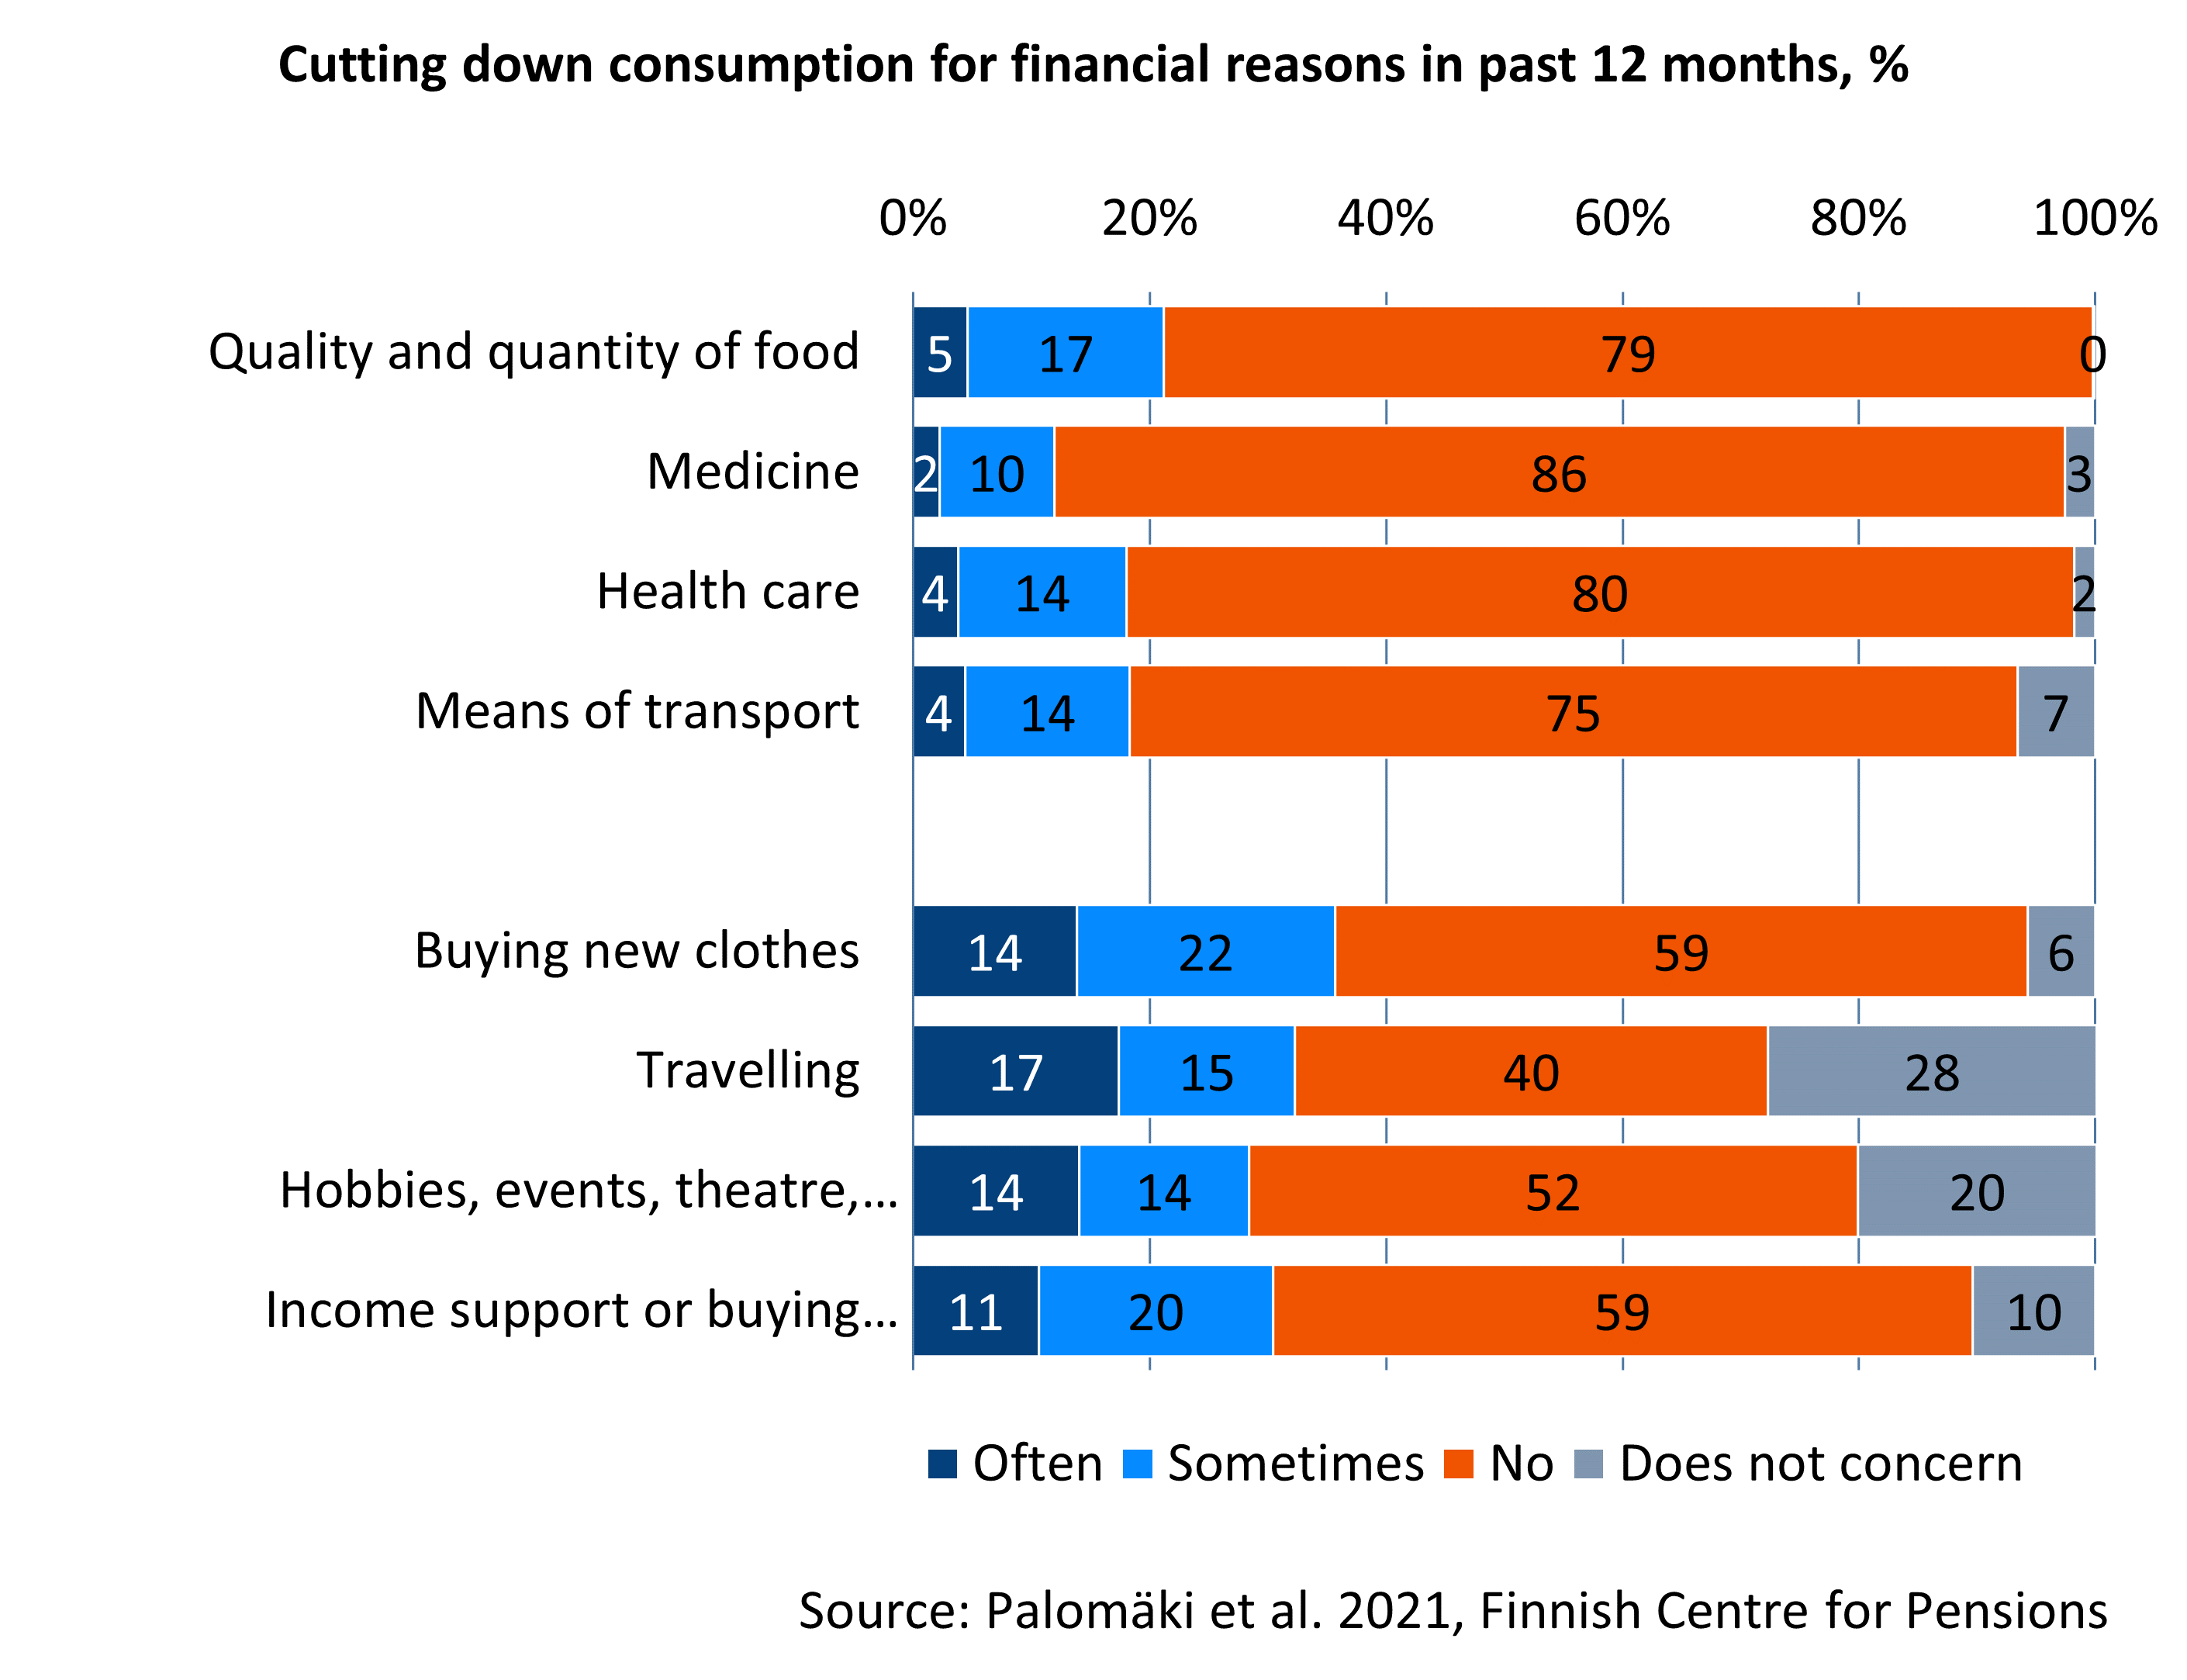
Most pensioners do not have to cut down consumption for financial reasons. If they had, they primarily cut down on leisure-time consumption and buying new clothes. Some were also forced to cut down on necessities such as food or medication.
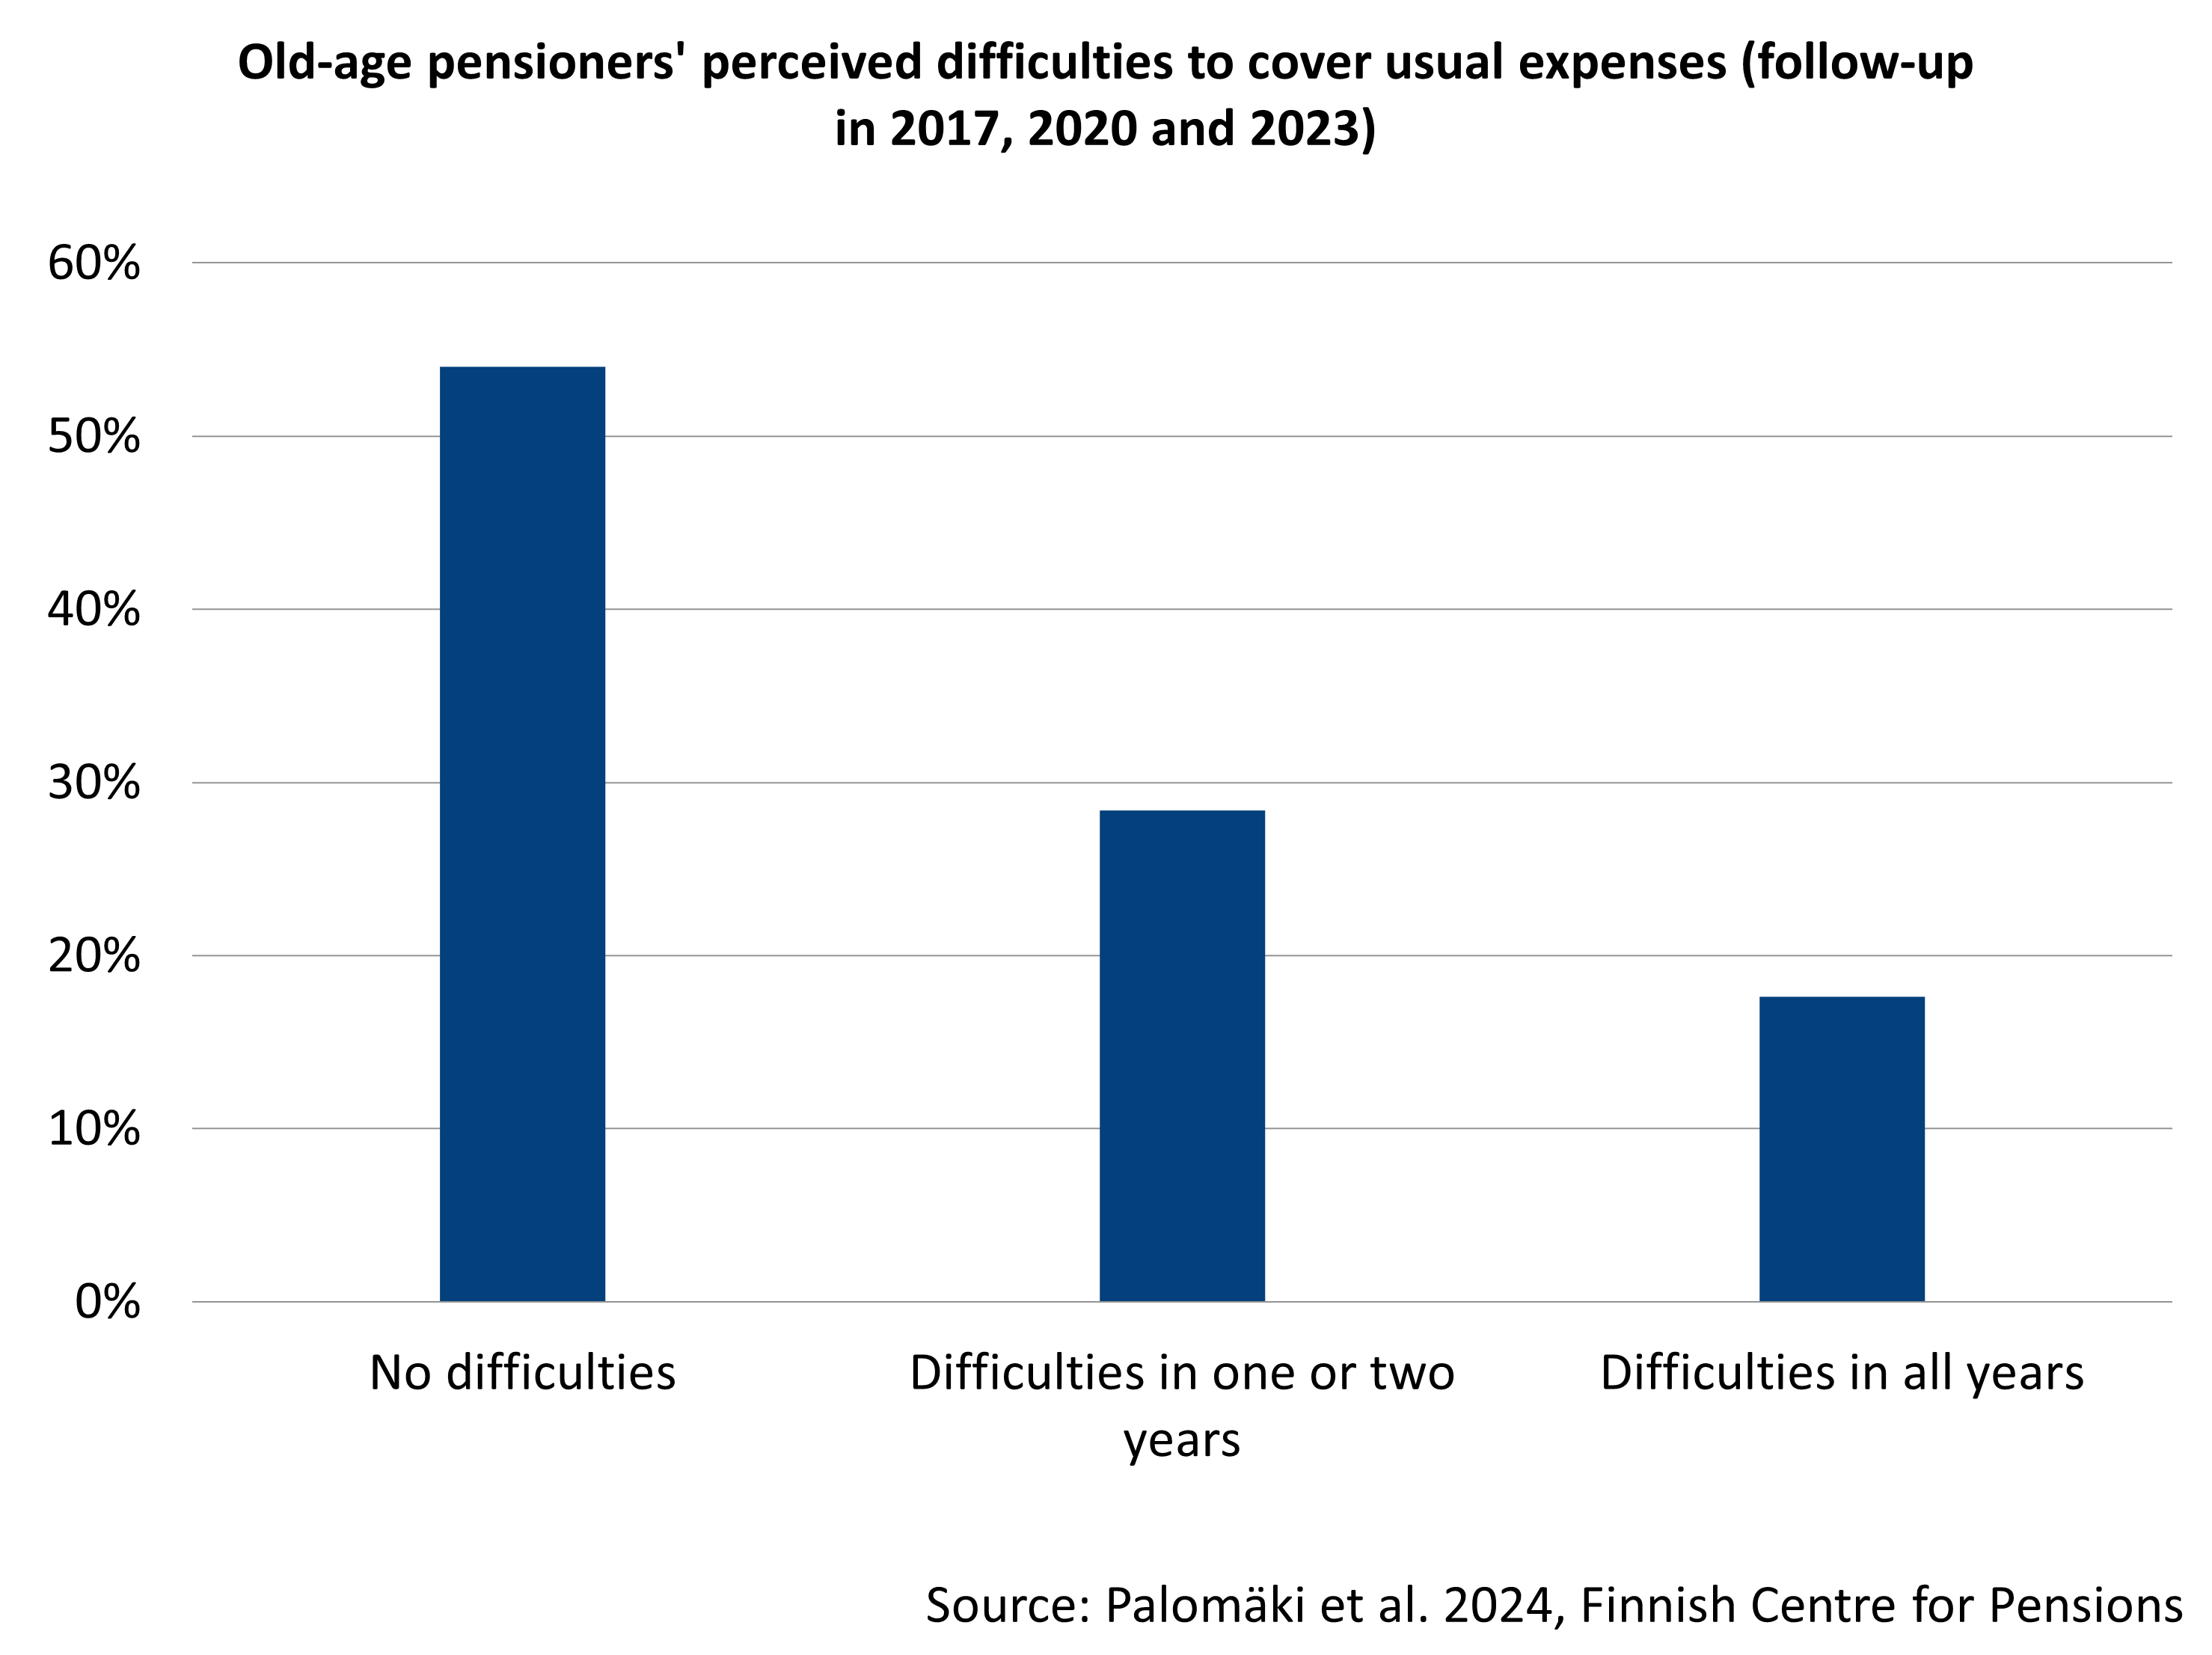
Typically, the income perceptions are permanent. Of old-age pensioners, more than half never struggled with making ends meet during the survey’s follow-up years (2017, 2020 and 2023). This perception was most common among those in a better financial situation. Slightly more than every fourth respondent experienced difficulties in one or two follow-up years, and slightly less than one in five struggled making ends meet in all three years. The last group was dominated by those in a weaker-than-average financial situation, those living alone and women.
Publications:
- Palomäki et al. 2021. 2021 Retirees’ economic wellbeing and subjective perceptions of livelihood in 2020 compared to in 2017 (Summary in English; Julkari)
- Palomäki et al. 2022. Longitudinal study of perceived economic welfare among Finnish old-age pensioners in 2017–2020 (Summary in English; Julkari)
- Palomäki et al. 2024. Longitudinal study of perceived economic welfare among Finnish old-age pensioners in 2017, 2020 and 2023 (Summary in English; Julkari)
- Palomäki et al. 2025. What it means to be poor: Dimensions of economic hardship among older people living in poverty across Europe (Cambridge University Press)
- Palomäki et al. 2025. Retirement timing and changes in quality of life: a retrospective analysis of transition from employment to old-age retirement in Finland (Springer)
- Riekhoff et al. A long arm of adversity? Financial hardship during the life course and income in retirement (European Societies)
There is no single definition for poverty or way to measure it, and there is no official poverty threshold in Finland. Often, poverty is examined based on income. Other ways to measure poverty is severe material deprivation or receiving income support. Different methods provide a slightly different picture of how common poverty in retirement is.
Pensioners are at risk of poverty as often as Finns on average
In 2024, around 11.6 per cent of pensioners were at risk of poverty when it was examined in the most common way. A person is viewed to be at risk of poverty when the disposable income of the household is less than 60 per cent of the population’s median income.
The temporal variation in the at-risk-of-poverty rate among pensioners is also greater than among the total population. For pensioners, the income is more often closer to the 60-per-cent poverty threshold than it is for the total population. Changes in the poverty threshold thus affect the number of pensioners at risk of poverty more than average.
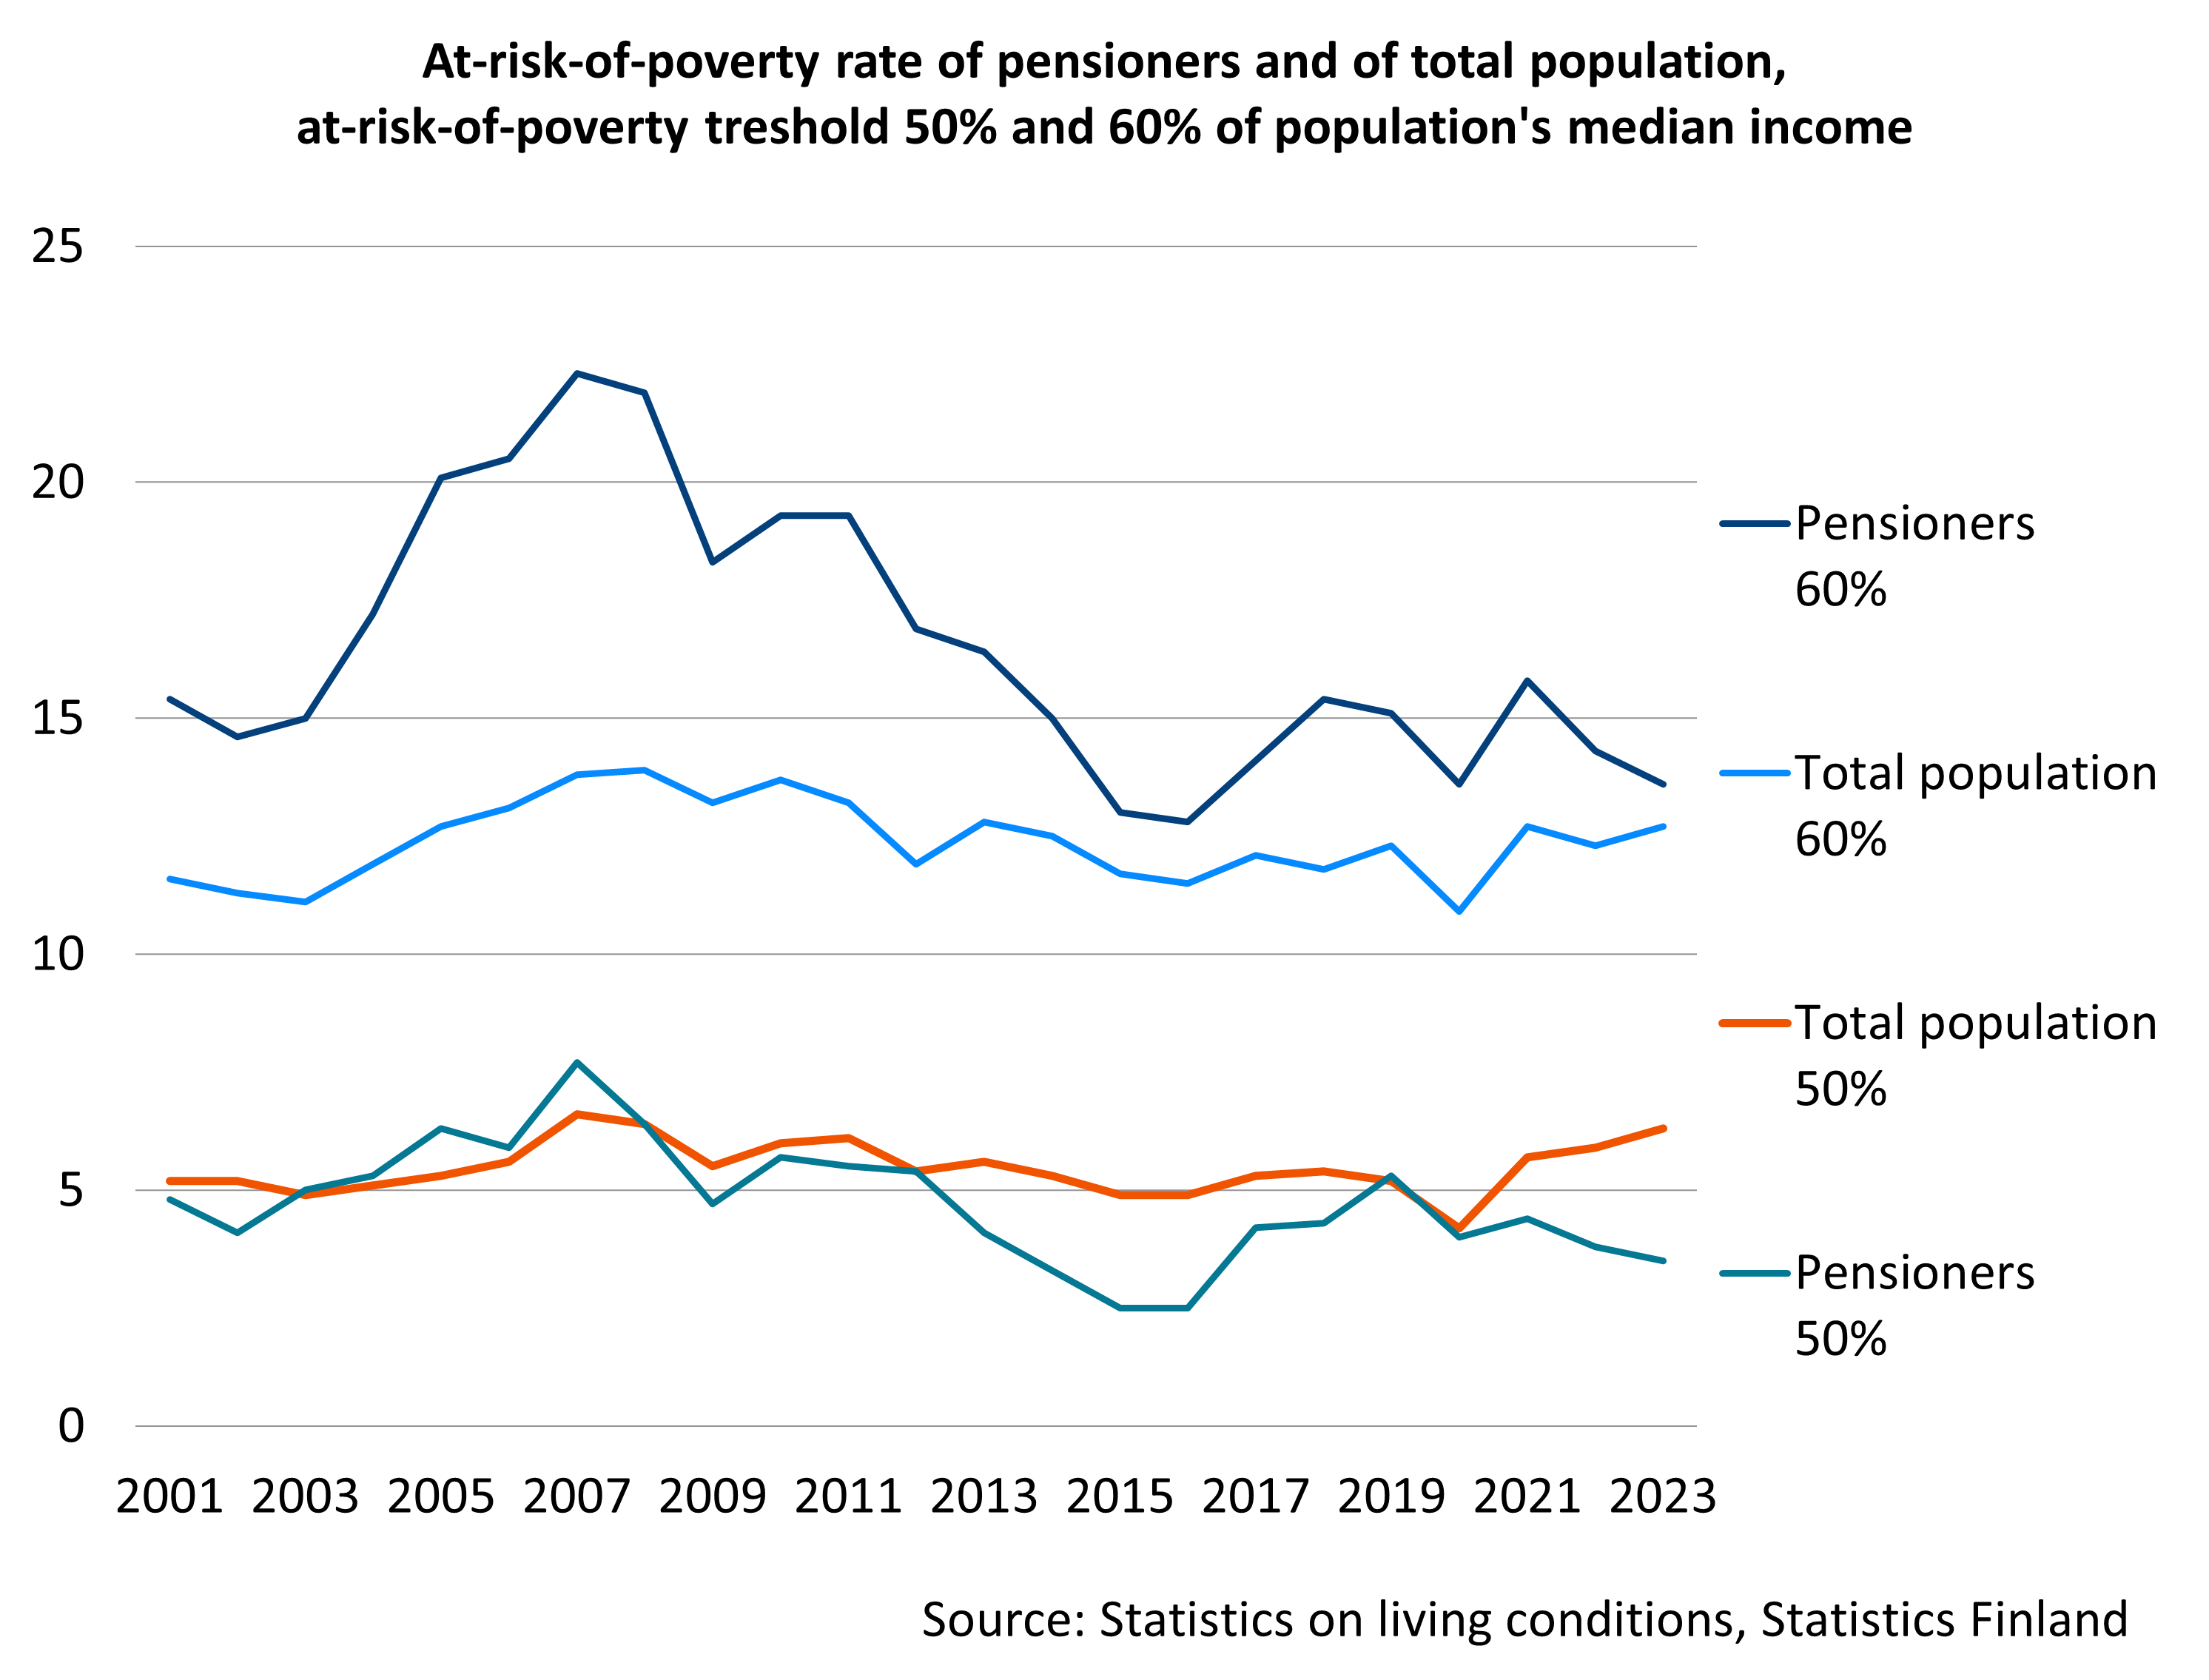
At the 50-per-cent threshold, pensioners are much less likely to be at risk of poverty and the temporal variation is much smaller than at the higher threshold. This means that the at-risk-of-poverty rate for pensioners is also closer to the at-risk-of-poverty rate for the total population.
Publications:
- Ilmakunnas 2022. The magnitude and direction of changes in age-specific at-risk-of-poverty rates: an analysis of patterns of poverty trends in Europe in the mid-2010s (Cambridge)
- Kuivalainen et al. 2022. Pensions and pensioners’ economic wellbeing – Development from 1995 to 2020 (Julkari, summary in English)
The youngest and oldest pensioners and those living alone more likely at risk of poverty
Pensioners are not a homogenous group in terms of income. Poverty is more common among the youngest and the oldest pensioners and pensioners living alone.
The at-risk-of-poverty rate of younger pensioners (effectively those on a disability pension) has tripled in two decades. By contrast, the at-risk-of-poverty rate of the oldest pensioners has not increased at all over the last decade.
Family size also affects risk of poverty. Pensioners who live alone are considerably more often at risk of poverty than those with a family. The youngest and oldest pensioners who live alone are at the highest risk of poverty.
Risk of poverty among women aged over 75 is more common than among men, partly because there are many women over 75 who live alone. Nevertheless, the gender gap has narrowed over the past 20 years as the risk of poverty among men living alone has increased.
Pensioners’ risk of poverty often inherited from time before retirement
For pensioners, the risk of poverty is somewhat but not significantly more common over the first ten years in retirement. Income changes relatively little during retirement. Many pensioners at risk of poverty are already living on a meagre income before retirement.
Long-term risk of poverty (being at risk of poverty in two out of three years) is more common among people aged over 75. Older women, in particular, are at risk of poverty for extended periods.
Publications:
- Ahonen & Kuivalainen 2024. Gender differences in old-age poverty in 14 EU countries: exploring the role of household structure (International Review of Economics)
- Kuivalainen et al. 2022. Pensions and pensioners’ economic welfare 1995–2015 (Summary in English; Julkari)
- Rantala et al. 2017. The economic welfare of disability pensioners’ in the 2000s (Summary in English; Julkari)
- Rantala et al. 2019. Samankaltaistuuko ikäihmisten köyhyys? Näkökulmia 75–84-vuotiaiden naisten ja miesten pienituloisuuteen (is the poverty gender gap shrinking – perspectives on poverty rates among older men and women aged 75–84) (Julkari)
- Rantala 2020. Studies on the dynamics of low income and economic well-being of pensioners in Finland in 1995–2014 (Summary in English; Julkari)
Pensioners less likely to have serious income problems
Receiving income support, suffering material deprivation and needing food aid often signal serious income problems. They are also considered one form of poverty.
Among pensioners, the share of persons receiving income support is clearly less than among the rest of the population. Around 1.3 per cent of the population aged 65 or over had received income support in 2024. The equivalent figure for the population aged between 25 and 64 was 7.4 per cent. Persons who have reached their retirement age typically receive income support for health care and medical expenses.
Of customers receiving food aid, around one third are pension recipients. Pensioners who used food aid had received it for a longer period than others, but they experienced problems with making a living less often than others. Pensioners seeking food aid lived alone and were, more often than others needing food aid, in poor health. In population surveys, a few per cent of pensioners have stated that they have had to resort to food aid.
The extent of material deprivation among people of retirement age as reviewed by the European Union is similar to that faced by those of working age. In Finland in 2024, fewer than one in 20 individuals – whether of working or retirement age – reported lacking essential items against their wishes.
Read more on Etk.fi:
- Ilmakunnas 2021. 60–70-vuotiailla aineellinen puute nuorempia ikäryhmiä vähäisempää (individuals aged 60–70 experience less material deprivation than younger age groups) (Blog 19 Feb. 2021; Etk.fi)
- Kuivalainen & Ylikännö 2020. Mummot ja papat eivät vain matkustele ja pelaa golfia – osa vanhuuseläkeikäisistä tarvitsee perustoimeentulotukea (grandmothers and grandfathers don’t just travel and play golf – some people of retirement age need basic indome support), Blog 1 Dec. 2020; Etk.fi)
Publications:
- Ilmakunnas & Mäkinen 2020. Age differences in material deprivation in Finland: How do consensus and prevalence-based weighting approaches change the picture? (Springer)
- Kuivalainen & Ylikännö 2020. Perustoimeentulotukea saavat vanhuseläkeläiset teoksessa Ojasta allikkoon? Toimeentulotukiuudistuksen ensi metrit (‘pensioners on an old-age pension who receive basic income support’ in ‘out of the frying pan and into the fire – the first steps of the income support reform) (Helda)
- Laihiala 2019. Eläkeläiset hyväntekeväisyysruoka-avun asiakkaina (pensioners as recipients of charitable food aid; Julkari)
- Palomäki ym. 2021. Pensioners’ perceived economic welfare in 2020 compared to in 2017 (Summary in English; Julkari)
An international evaluation of the Finnish pension system finds that the system efficiently averts poverty and provides a reasonable income for pensioners.
Overall, Finnish pensioners (aged 65 and over) are managing slightly better than average when compared to their counterparts in other EU countries. The purchasing power of pensions is somewhat higher than the EU average and the risk of poverty among the older population is lower than the EU average. However, the income of Finnish pensioners, in relation to those of working age, is below the EU average.
Read more on Etk.fi:
Publications:
- Andersen 2021. Pension adequacy and sustainability – An evaluation of the Finnish pension system (Julkari)
- EU 2021. 2021 pension adequacy report (EU)
- Kuivalainen et al. 2022. Pensions and pensioners’ economic wellbeing – Development from 1995 to 2020 (Summary in English; Julkari)
- OECD 2023. How does Finland compare? (OECD)
- OECD 2023. Pensions at a Glance 2023 (OECD)
Financial difficulties less common among pensioners in Finland than in other European countries
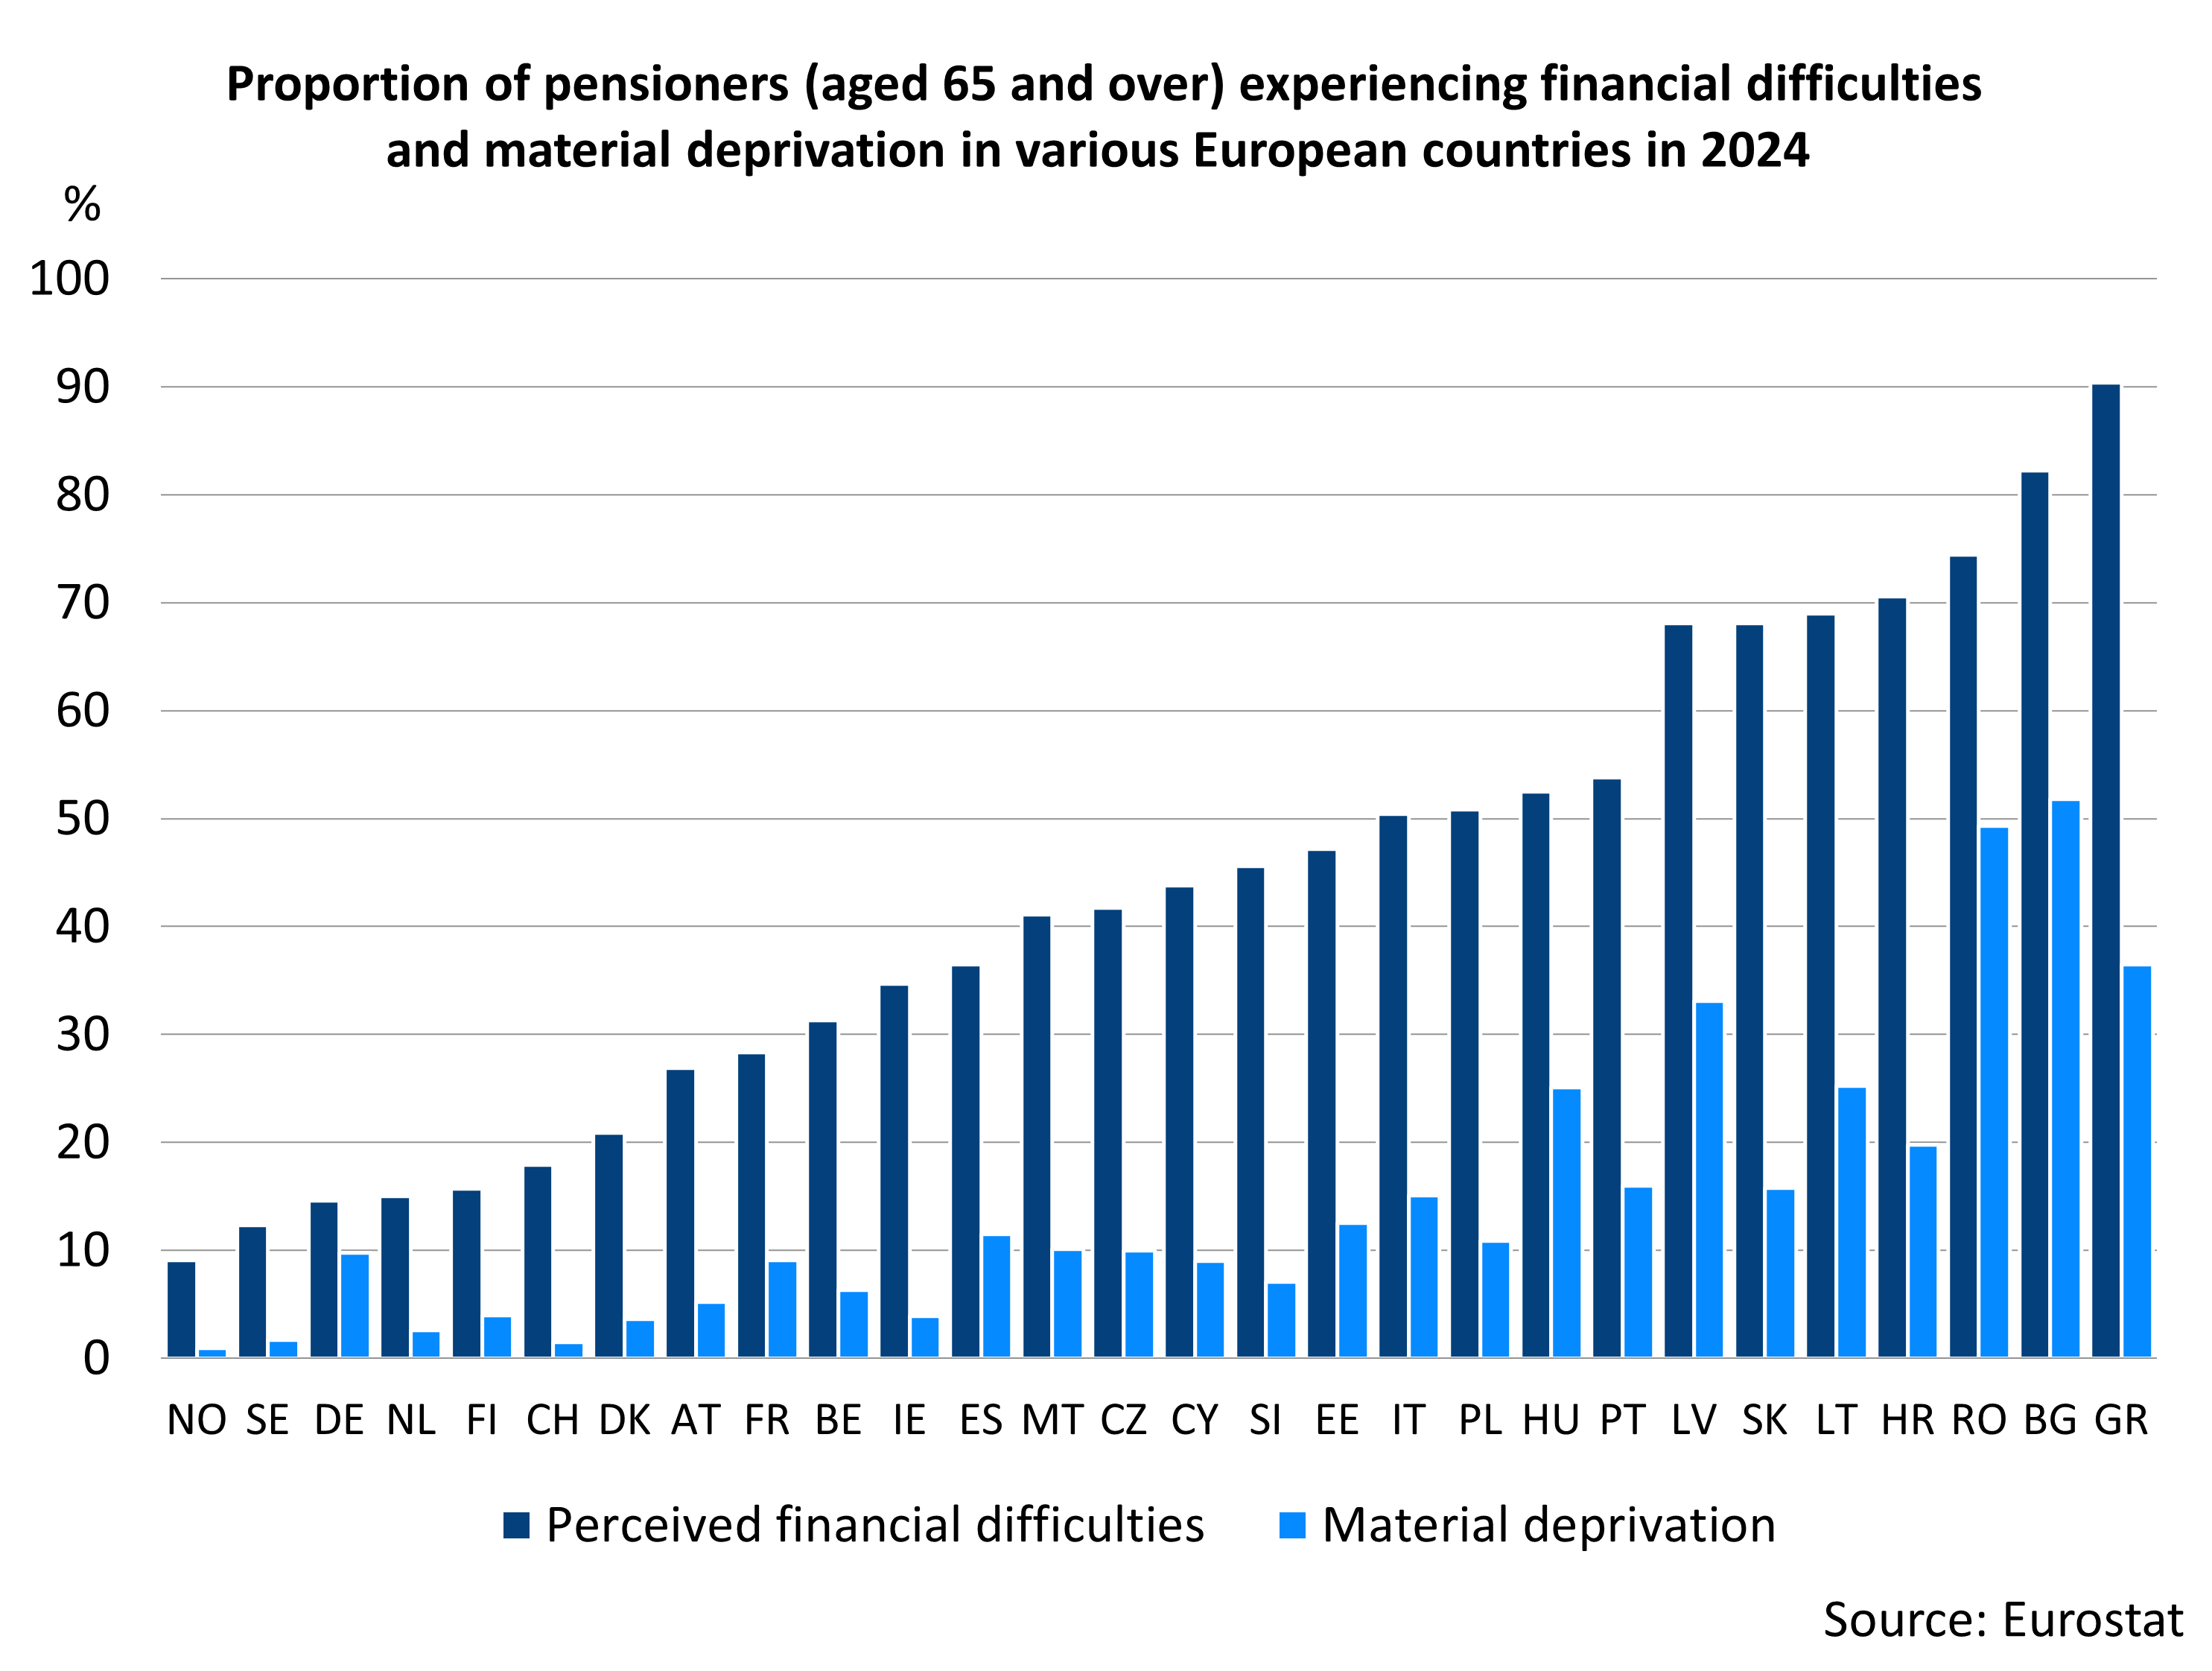
Compared to other European countries, Finnish pensioners clearly less often experience income difficulties. In 2024, 16 per cent of pensioners in Finland faced at least minor financial difficulties, whereas the EU average was 43 per cent. Similar differences between countries can be observed when examining how often pensioners have had to forgo activities they would have liked to pursue due to a lack of funds.
In Finland, as in many other European countries, people of pensionable age (aged 65 and over) are less likely to experience income difficulties than younger people. This remains true even when taking income disparities between different age groups into account.
Compared with many other nations, Finnish pensioners are more likely than younger people to own their home without a mortgage and to have savings to help maintain their standard of living.
The material deprivation indicator sheds light on the lack of basic needs for financial reasons. Pensioners in Finland experience material deprivation less frequently than the European average. For example, in 2024, fewer than one in twenty Finnish pensioners suffered material deprivation, while in EU countries, nearly three in twenty pensioners faced such difficulties.
Read more on Etk.fi:
- Palomäki 2020. Kuva suomalaisten ikääntyneiden elämänlaadusta riippuu näkökulmasta (perception of quality of life of older Finnish people depends on the viewpoint) (Blog in Finnish on 7 Febr. 2020; Etk.fi)
- Palomäki 2024. Eurooppalainen vertailu: miten pienituloiset eläkeläiset tulevat toimen arjessaan? (European comparison: how do low-income pensioners manage in their daily lives?) (Blog in Finnish, 13 March 2024; Etk.fi)
Publications:
- Ilmakunnas et al. 2024. Association between age and subjective economic hardship across the income distribution in Europe (Julkari)
- Kuitto et al. 2021. The financial situation across the life-course (Väestöliitto)
- Palomäki 2018. Pensioners’ subjective economic well-being in European countries. Comparisons behind the income satisfaction paradox (Summary in English; Julkari)
- Palomäki 2019. Does It Matter How You Retire? Old-Age Retirement Routes and Subjective Economic Well-Being (Social Indicators Research)
- Palomäki et al. 2022. Size or Content of the Pie? Source of Income and Perceived Income Adequacy of Older Europeans (Tandfonline)
- Palomäki et al. 2024. Dimensions of economic hardship among older people living in poverty across Europe (Cambridge University Press)
- Riekhoff et al. 2024. A long arm of adversity? Financial hardship during the life course and income in retirement (European Societies; OSF Preprints)
The Finnish Centre for Pensions conducts research on pensioners’ income and its development about every five years. The latest study was published in 2022.
- Pensions and pensioners’ economic wellbeing – Development from 1995 to 2020 (Julkari, summary in English)
- Pensions and Pensioners’ economic welfare 1995–2015 (Julkari, Summary in English)
- Pensions and Pensioner Income 2000–2010 (Julkari, Executive Summary in English)
- Pensions and Pensioner Income 1990–2005 (Executive summary in English, Julkari)
- Eläkeläisten toimeentulo 1990-luvulla (pensioner income in the 1990s), (Julkari)
FAQs
The guarantee pension, introduced in 2011, is designed to ensure a minimum income for pensioners. It is paid to individuals whose national and occupational pensions fall below a legally defined threshold. In 2024, around 116,500 people received the guarantee pension. To be eligible, the total amount of pensions received (before tax) must be less than 978.34 euros per month (as of 2025).
In 2025, the median monthly pension was 1,886 euros.
More on other sites:
There is no general definition for a large pension. In this context, the issue is approached using income survey methods, by examining the threshold for the top decile of pension incomes, and by considering the proportion of pensioners whose monthly pension is at least two or three times greater than the average monthly pension.
In 2024, the threshold for the top 10 per cent of pension incomes among pensioners living in Finland was 3,388 euros per month. This means that 10 per cent of pensioners (around 150,000 people) had a gross monthly pension of this amount. Meanwhile, just 0.5 per cent of pensioners received a monthly pension exceeding 7,500 euros.
In the same year, approximately 9 per cent of pensioners received a monthly pension at least twice the median pension (that is, over €3,400). Similarly, less than 2 per cent of pensioners received a pension at least three times the median (over €5,500 per month). These proportions have remained largely unchanged since the mid-1990s.
Read more on other sites:
Publications:
In 2024, around 11.6 per cent (or 167,000 individuals) of Finnish pensioners were at risk of poverty, that is, they had a disposable monetary income of less than 60 per cent of the median income of the total population.
There is no official definition of poverty in Finland. Often, poverty or the risk of poverty is reviewed in terms of income. According to the most general definition, a person is at risk of poverty if their disposable income is less than 60 per cent of the median income of the Finnish population. Statistics Finland calls persons who face the risk of poverty for low-income earners. Each year, Statistics Finland publishes statistics on low-income earners based on its statistics “Survey on income and living conditions”.
The poverty threshold can also be set at, for example, 50 per cent of the population’s median income. The number of low-income pensioners varies significantly depending on the at-risk-of-poverty threshold.
| At-risk-of-poverty threshold and concept of income | Share of pensioners, % | Number of pensioners at risk of poverty |
|---|---|---|
| 50% of population’s disposable income | 2.7 | 38,000 |
| 60% of population’s disposable income | 11.6 | 167,000 |
More on other sites: