Pension Levels
On a regular basis, the OECD and the EU publish reports on and comparisons of pension levels in various countries. The biannual report Pensions at a Glance, published by the OECD, compares the pension level and the structure and financing of pensions in OECD countries. The most recent Pensions at a Glance report was published in December 2023. The most recent report, the Pensions Adequacy Report (PAR) was published by the European Commission in June 2021. The PAR report is published every third year.
Pensions in OECD countries
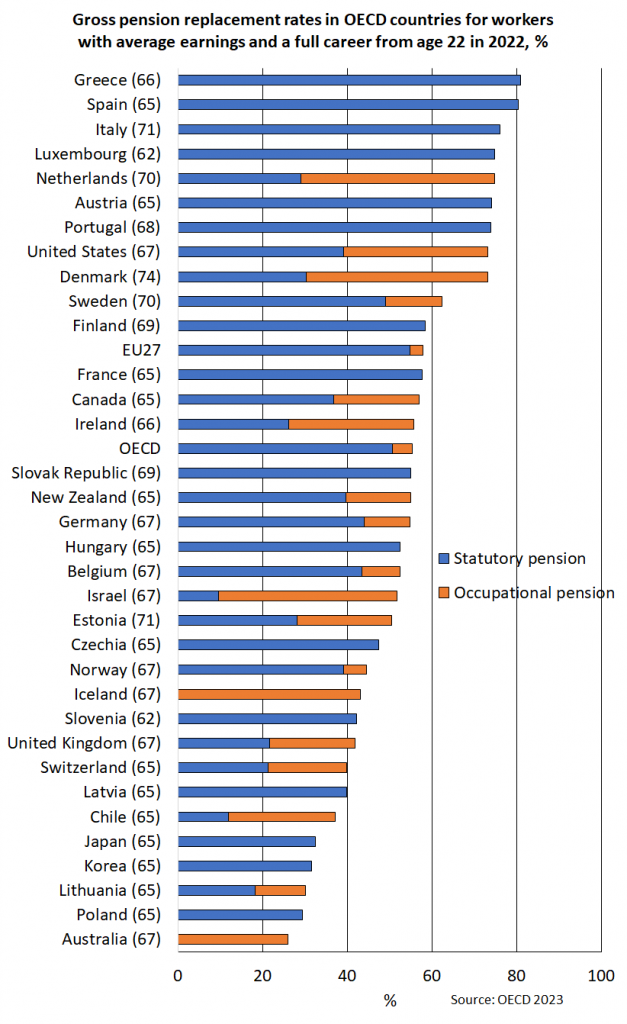
In December 2023, the OECD published an extensive survey of pensions in its different members states and the G20 countries. Pensions at a Glance is published biannually. The selection of indicators used in the report includes, among other things, comparisons relating to the level, structure and financing of pensions.
The OECD measures the replacement rate of pensions under the assumption that a person’s working life extends from age 22 to the national retirement age (69 years in Finland). In the comparison of the replacement rate of pensions, the future pension of a Finnish employee with an average income is slightly over the OECD average when supplementary pensions, which are part of the total pension provision in many countries, are included in the comparison. The OECD average pension amounts to 55 per cent of the pre-retirement wage. The equivalent rate in Finland is 58 per cent. The replacement rate for low-income wage earners is below the OECD average (58.4% vs. 63.8%) and higher among the high-income wage earners (58.4% vs. 42.3%).
Significant changes in pensions between EU countries
The Pension Adequacy Report is compiled jointly by the European Commission and the Member States. It offers an extensive overview of European pension policies, focusing on pension adequacy of old-age incomes today (2019) and in the future (2059).
The report includes numerous different indicators and alternative projections to measure the levels of old-age income provision. As a rule, the projections include the old-age pensions of the statutory pension systems. Depending on the country, the projections may also include 2nd-pillar pensions if they have broad coverage in the country. 3rd-pillar pensions are not included in the projections.
The report examines the pension levels produced by various careers through theoretical replacement rates (TRR). The pension level is reported as a net and gross replacement rate of a person with a computational working life, or as a gross pension relative to gross earnings and a net pension relative to net earnings. By reviewing different working lives, the effect of, for example, child care or part-time working on pensions, can be established. In addition, it is possible to reviews the differences in replacement rates of people who belong to different income brackets.
The graph below presents the replacement rates of the new base case (based on PAR data) in different EU countries. The gross and net replacement rates are those of an average income person who retires in 2019 when reaching the national retirement age (63,5 years in Finland) after 40 years of work. In some countries, the retirement ages differ for men and women. In that case, the replacement rates are those of men. Equivalent projections have also been made for the future under the assumption that the person starts working in 2019 and retires 40 years later in 2059 at the national retirement age (67 years and 8 months in Finland).
The replacement rates in EU countries vary from 35 (Estonia) to 106 (the Netherlands) per cent. The computational replacement rate for Finnish pensions is EU average. As a rule, the net replacement rates are higher than the gross replacement rates because of, among other things, taxation structures. The tax rate for higher wages tends to be higher than for lower wages, which is why the net pension and the wage are usually closer to each other.
More on other sites